For my 10th birthday my grandparents gave me a massive Collins encyclopedia – a 1960 update of the known universe. Among the collection of images were pictures of various planetary bits and pieces, the moon and Halley’s Comet, with the clarity of the Mt. Palomar Observatory telescope; images that set the imagination reeling. Technology back then was firmly attached to terra firma. Only three years earlier Sputnik had entered the history books. Six decades later and I still have that sense of excitement, but now there’s a constant pictorial stream, with amazing clarity and detail of a comet’s surface, close encounters with Jupiter, vapour plumes erupting from Enceladus, Saturnian rings, and Mars rovers. We can observe sand grains entrained in dunes that move across the Martian surface. A barrage of images and videos, almost in real-time (not counting the 13 minutes it takes for the signal to reach us).
HiRISE steps this imagery up a notch. The High Resolution Imaging Science Experiment is a camera, one of 6 instruments on the Mars Reconnaissance Orbiter, a satellite tasked primarily with finding water on Mars (in orbit 2006). The HiRISE camera captures images in the visible part of the light spectrum – much the same as the human eye, but its real advantage is a telescopic lens that can resolve objects as small as a metre across. The images show amazing detail of land forms on the Martian surface. But HiRISE also does something else – it captures pairs of images, each taken at a slightly different angle to the other that, with a fair bit of operator and computer processing, provide the wherewithal to create fantastic 3-dimensional views of features like erosional gullies and ancient river beds, craters, sand dunes, and glaciers. In fact, it was the 3-D image of a glacier posted on Twitter, that piqued my interest in this project.
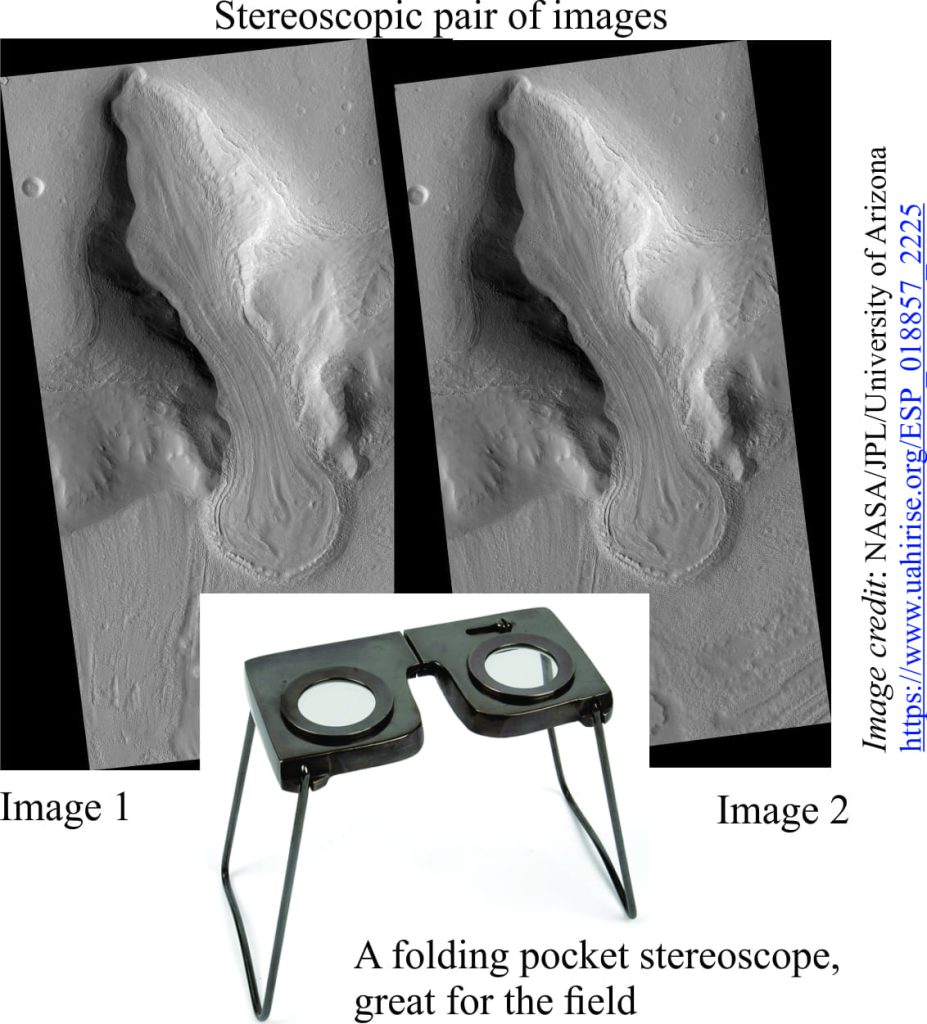
This particular glacier occurs in a region known as Protonilus Mensae and was first imaged by HiRISE in 2010. Two images were taken, both with the same longitude, but differing in latitude by only 0.001 degrees (the satellite was about 300km from the surface at that time). Together, the two images make a stereo pair. The word stereo here means that when the two images are placed side by side and viewed with the naked eye, the two separate images can be merged, with a bit of coaxing of your eyes, into a single image where objects such as ridge tops, cliffs, or large boulders appear to rise toward you. In other words, the image comes to life as a 3-dimensional view. It is possible to train your eyes to perform this visual transformation, or you can use a stereoscope, which contains two lenses that magnify the images. Earth scientists have employed this method for decades to visualize geological structures and land forms, mostly using black and white aerial photos.
For comparison, think Magic Eye, popularized in the 90s, where an image was seemingly a hodgepodge of colour that, when the eyes became focused, turned into a fascinating scene. A Magic Eye scene also consists of two images that are slightly offset (stereo pairs); the principle of stereoscopic pairs here is the same as that used to produce the wonderful images of Mars’ surface. However, in the case of HiRISE, the images are digital, and creating the stereo effect can be automated using specially designed computer software. The data produced by HiRISE (and other satellites) takes this method of visualization to a whole new level of sophistication.
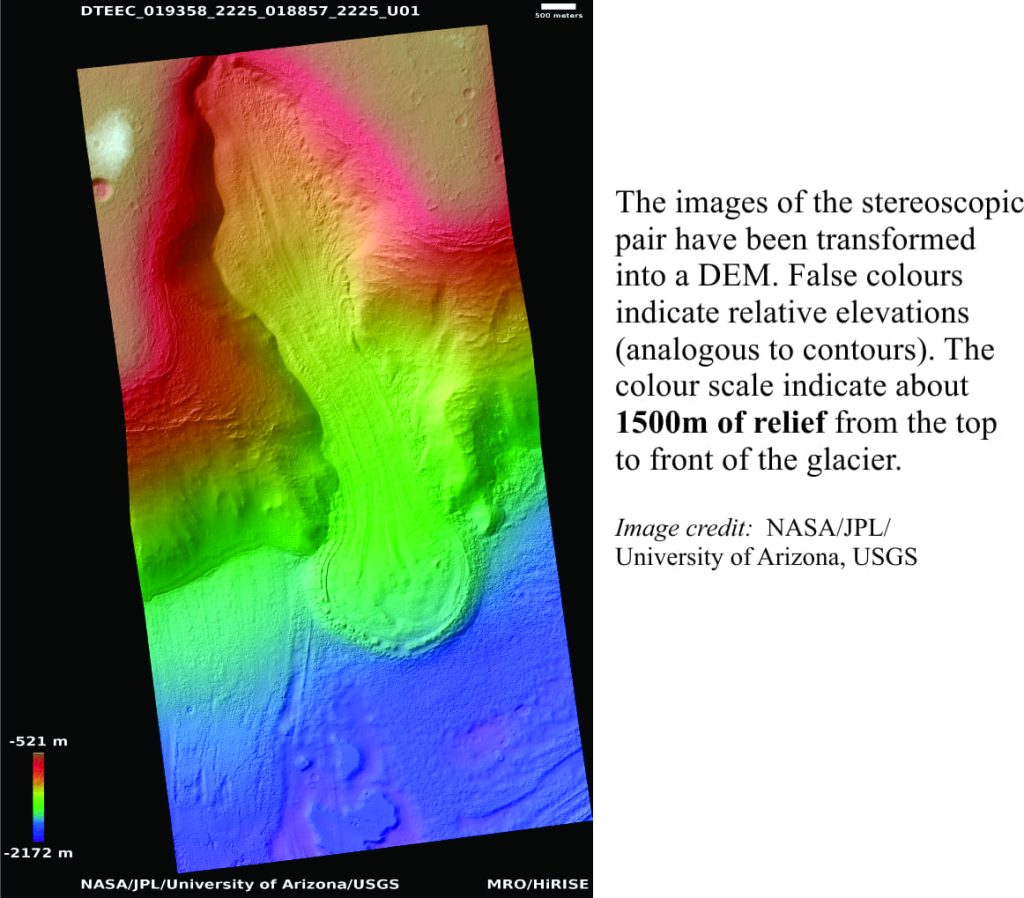
HiRISE stereo pairs are all downward looking. But what if we were able to view, for example, erosional gullies or a glacier from the front, or from the side? The 3D image obtained from the stereo pair, because it is digital, can be transformed into a DEM, or Digital Elevation Model. Think (again) of a typical topography map, the flat paper version, with contour lines indicating differences in elevation from one place to another (hills, valleys etc.). That same map can also be represented digitally, such that any point on the map has an elevation (usually metres above sea level), and coordinates like latitude and longitude. The original (flat) map can be transformed, by using some fairly complex maths and lots of computing time, into a 3-dimensional representation that mimics the actual landscape. This new representation of our map is a digital topography model, or in more common parlance, a Digital Elevation Model.
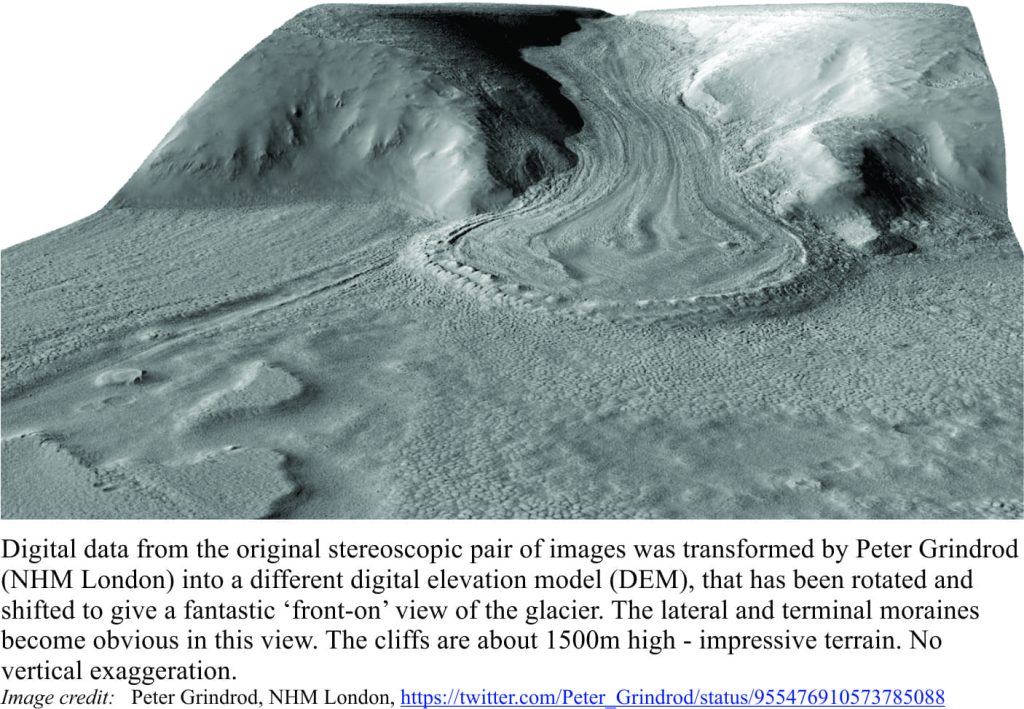
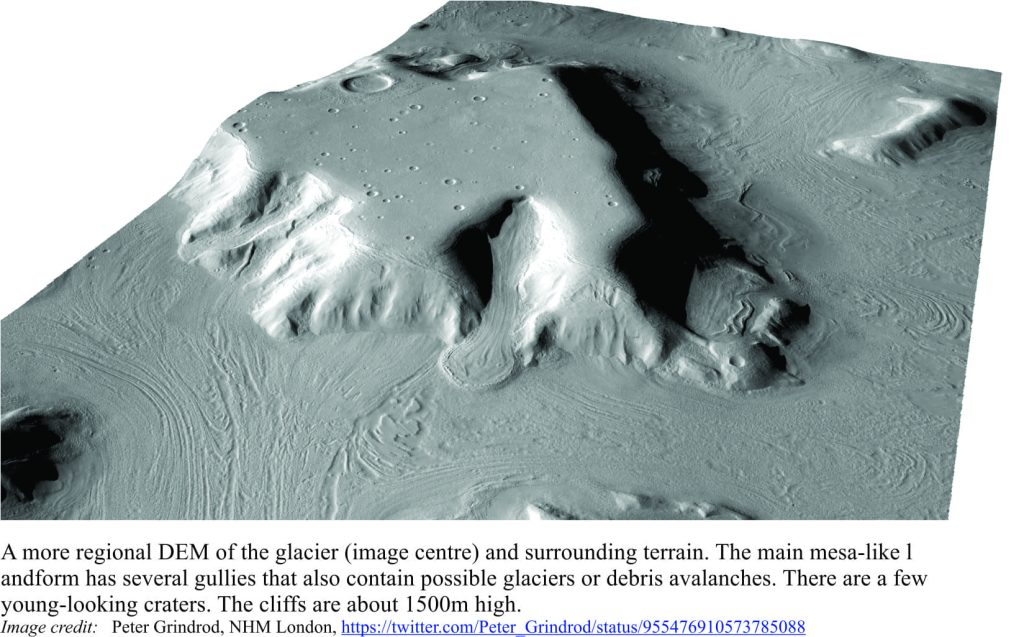
Many of the HiRISE stereo pairs have been transformed to DEMs (not all the pairs have been transformed because the task takes a fair bit of operator and computer time). The really neat thing about DEMs is that the models can be rotated on a computer screen to almost any angle you wish. It is also possible to change the position of a virtual sun, so that rotating the model in one direction may enhance certain features because of a change in shadows.
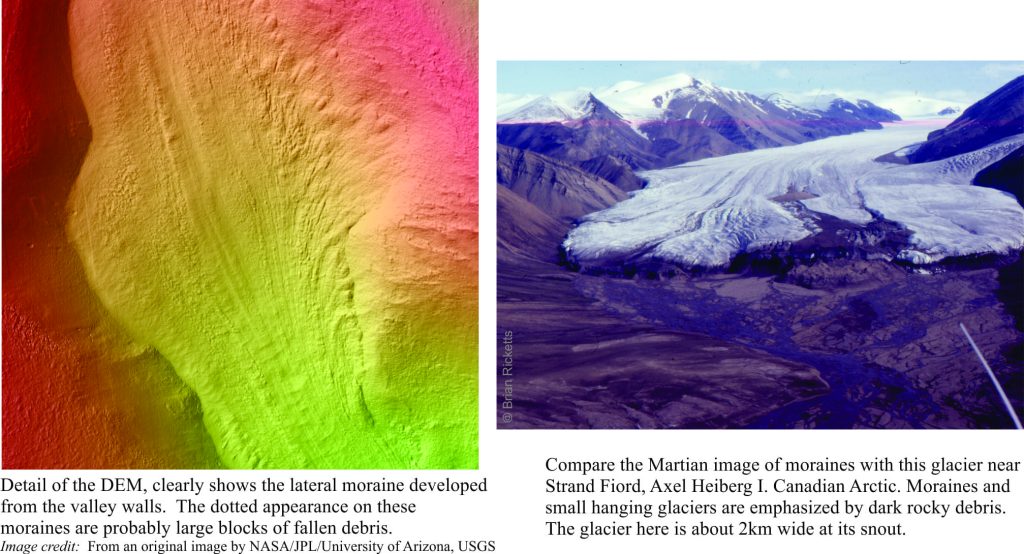
The image of the glacier that caught my eye (on Twitter), was transformed in this way. The DEM was created by Peter Grindrod, researcher in Planetary science, at the Natural History Museum in London. He presented views from the glacier snout looking up the valley, and from the top of the valley looking down. Views like this, that are faithful to the original data, emphasize some of the glacial features such as possible terminal moraines (at the front of the glacier), and lateral moraines (along the margins) that are comparable to terrestrial glaciers. They also present the viewer with a sense of size, or distance, a context that flat, 2-dimensional images may not convey. In some ways, it’s a bit like standing in front of this river of ice and being overwhelmed by the enormity of the landscape. According to the colour scale on the NASA/JPL/UOA/USGS DEM image, the cliffs here are about 1500m high.
The DEMs shown here, created from flat, 2-dimensional digital images, not only enhance our visual perspective (and enjoyment), but also help to improve our understanding of natural processes, in this case Martian processes. DEMs have been used for at least three decades to visualize terrestrial landscapes – they are now being employed to help us learn more about our solar system neighbours. On some future mission, someone may walk up to the glacier snout and take a photograph, with another astronaut standing in for scale. I hope I’m around to witness that event.
Here is a link to the satellites orbiting earth, that are tasked with collecting scientific data.
