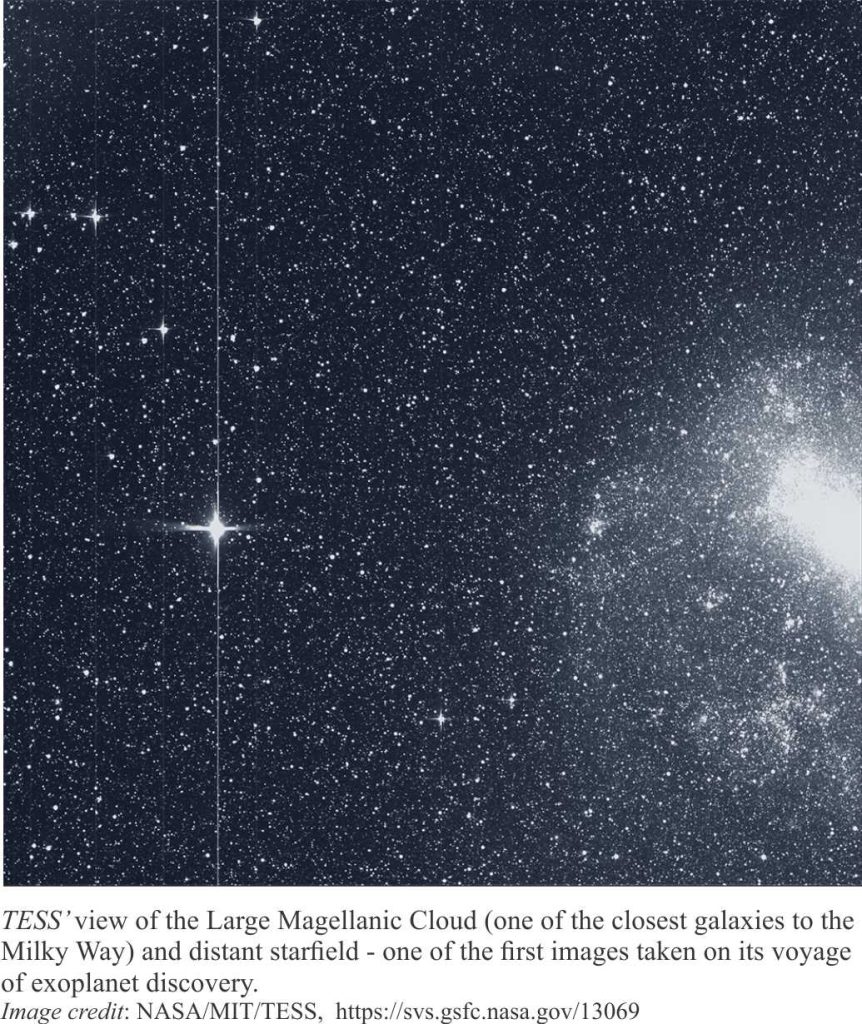
How many stars are there in our own galaxy, the Milky Way? A number frequently bandied about is 100 billion. This is a nice round number. The number could be as high as 400 billion; also a nice round number. In an interesting coincidence, the number of galaxies is estimated at 100 billion, a number that will no doubt increase as we peer into the farthest recesses of the universe. So, a 100 billion galaxies, and in each 100-400 billion stars – the numbers are getting out of hand (even for a geologist who works in millions of years).
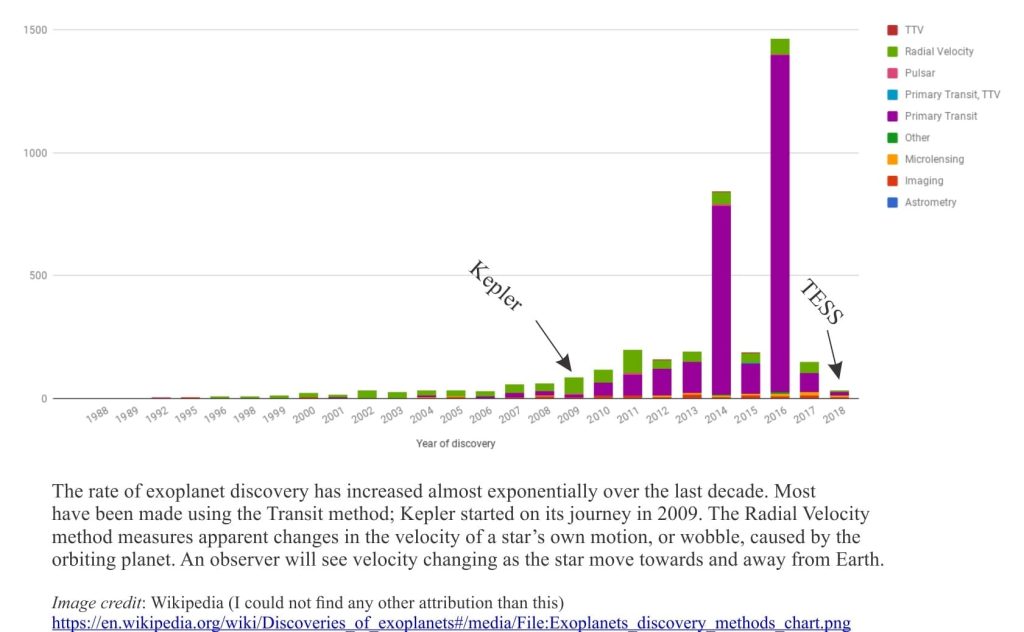
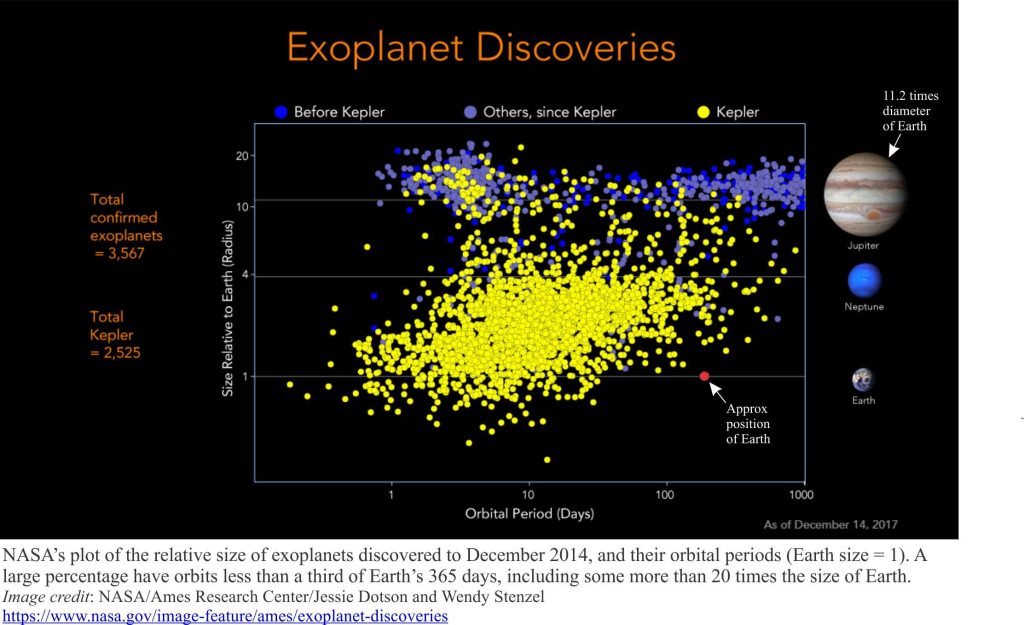
So when astronomers announce that there are probably more exoplanets than stars in our own galaxy (ergo all the other galaxies), our ego-centric view of the universe seems just plain silly. As of September 25, 2018, there w)ere 3779 confirmed planets, 2737 NASA candidates, and 2819 solar systems (that figure in 2025 is >7000. The graph below shows the astonishing rate of discovery over the last two decades; 2016 was a banner year with almost 1500 identifications. The NASA plot shows the estimated planet size and orbital periods, relative to Earth; the majority of exoplanets apparently whiz round their stars in less than 100 days, some in a few hours.
So, how does one discover a new exoplanet?
Having a decent telescope at your disposal is a good start. Land-based telescopes are okay, but the real successes have been with orbiting, satellite-based telescopes. Kepler was launched by NASA in March 2009 and was tasked with watching a swath of sky containing about 150,000 sun-like stars. About 70% of the discoveries so far have been made by Kepler. The second orbiting observatory, TESS (Transiting Exoplanet Survey Satellite), launched April 18, 2018, is also dedicated to finding exoplanets, and in its first few days of operation has made some exciting discoveries.
Kepler and TESS use a method of detection called Transiting – several other methods have been used but the transit method has been the most successful (e.g. Radial Velocity measures apparent changes in the velocity of a star’s own motion, or wobble, caused by the orbiting planet. An observer will see velocity changing as the star move towards and away from Earth. A nice summary of detection methods has been compiled by The Planetary Society). A transit occurs when a planet passes between its star and an observer on (or orbiting) Earth. The planetary disc will block some of the star’s light, and if the telescope is pointing in the right direction, the reduction in luminosity can be measured. Planetary orbits are periodic. Therefore, an important part of the analysis is observing dimming at regular intervals.
Astronomer Edmund Halley (of Halley’s comet fame), and Captain James Cook provide us with a useful historical analogy. Halley surmised that observations of Venus during its transit of the Sun, from different geographical locations, would permit calculations of astronomical distances, and hence, the size of the solar system (the calculations involved simple trigonometry). Cook was dispatched to Tahiti in time for the June 4, 1769 transit. The disc presented by Venus is small compared to the Sun, but there is a measurable decrease in light during its transit.
A more dramatic example of a transit occurs in our own backyard, when the Moon passes between the Sun and Earth during daylight hours. Partial eclipses produce observable dimming of sunlight, but a full eclipse delivers brief twilight. This principle also applies to exoplanets.
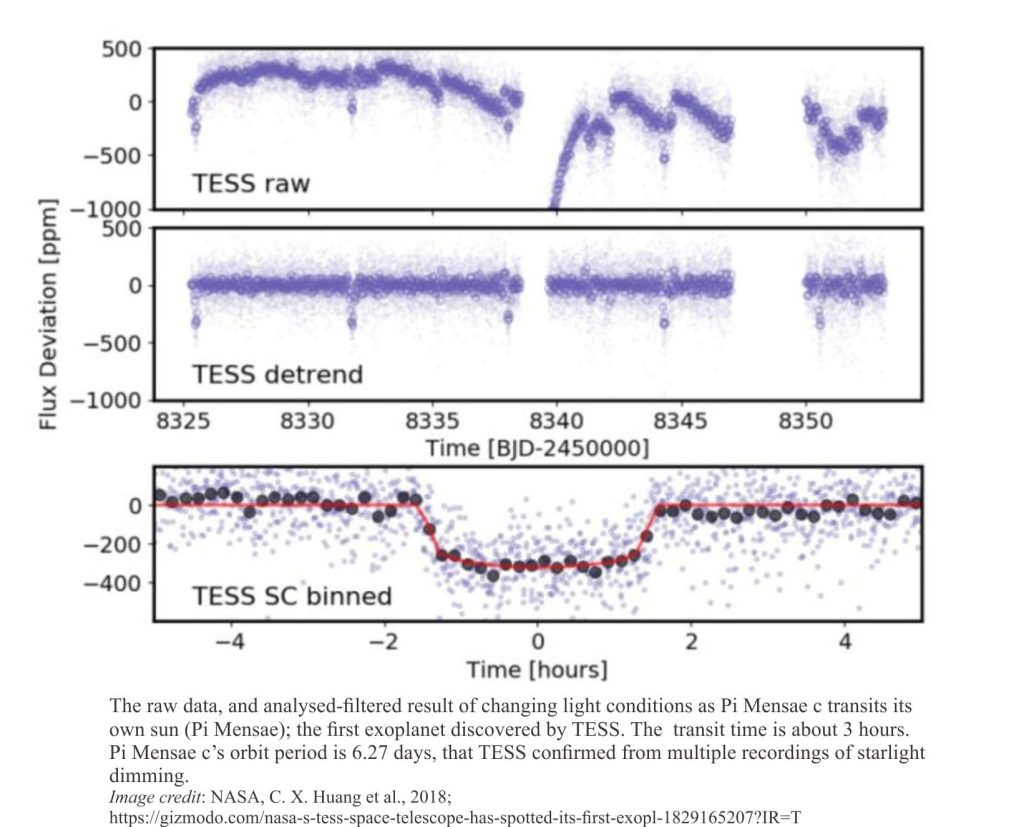
In its first few days of operation, TESS discovered a planet orbiting the star Pi Mensae, a bright dwarf star about 60 light years from Earth. The observed period of starlight dimming indicates that Pi Mensae c has an orbit of only 6.27 days. But what about its size – its radius and mass compared to Earth?
Astronomers start by measuring the size of the star; this they can do quite accurately because stars are fairly predictable. The brighter a star, the hotter it burns. Thus, the colour spectrum emitted provides a good indication of its temperature. Knowing the brightness and temperature it is then possible to calculate the surface area of the star (the larger the surface area, the more light it will emit), and if surface area is known, simple arithmetic will give you the star’s diameter.
During a planet’s transit, a measurable proportion of star light will be dimmed – in other words, the planet will dim the light in proportion to its size. Bingo! We now know the size (radius) of our exoplanet. But we still need to know how ‘heavy’ it is.
This is determined by observing the gravitational tug of war between the planet and its sun. The orbiting exoplanet will cause its sun to wobble about its axis; the degree of wobbling will be proportional to the exoplanet mass (we already know the star’s mass). These very small gravitational perturbations can be measured by Kepler, TESS, and earth-based telescopes.
Knowing the exoplanet size and mass, gives us all the information we need to calculate its density. Newly discovered Pi Mensae-c has a radius 2.14 times, and a mass 4.82 times that of Earth. So it is roughly Earth-size, but too close to its sun to be habitable.
The Transit method is not without its drawbacks. Importantly, the exoplanet orbit must be aligned with the observer. There must be as many orbit geometries as there are planetary systems in our galaxy, which means our telescopes can detect only a fraction of all possible exoplanets. Binary stars (i.e. two stars in very close proximity having mutual orbits) can also complicate observations of transit and gravitational wobbles. Celestial bodies the size of Jupiter can also be problematic because this size range can include some dwarf stars.
I don’t know about you, but it seems that new discoveries or exploration events are announced almost on a daily basis. Some of the latest excitement centers on two small robots that are playing leap frog on asteroid Ryugu. The number of questions seems to expand exponentially, the more we delve into our universe. Exoplanet science will go a long way to answering some of the questions.
