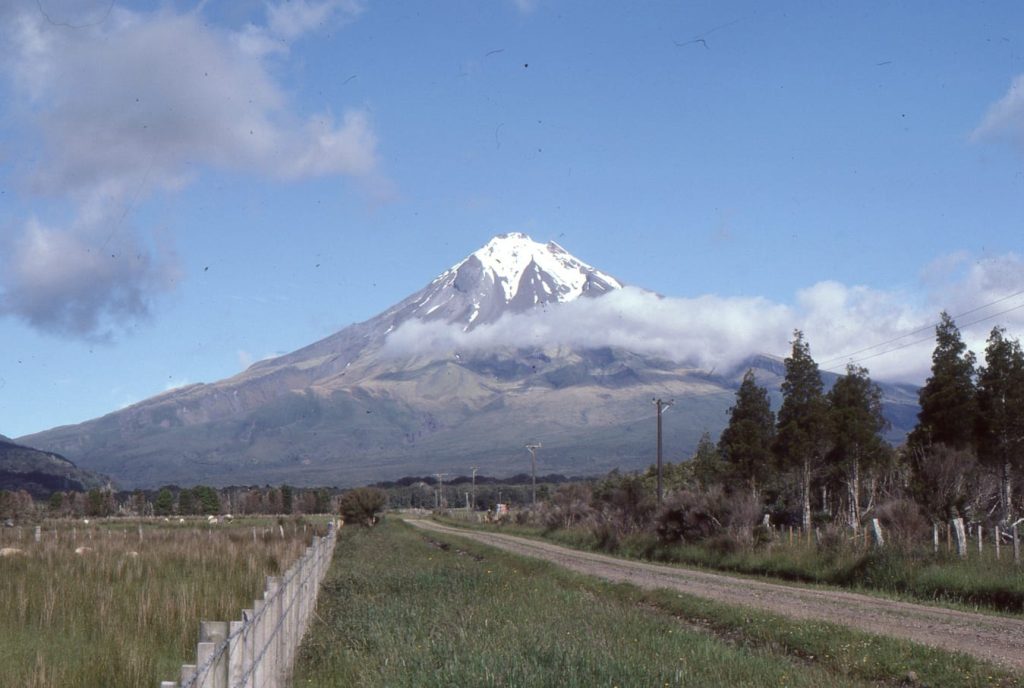
The thermal structure of the lithosphere influences its strength and rheology, and the diagenetic-metamorphic changes in sedimentary basins.
Temperature is a major control on processes that take place within sedimentary basins. The chemical reactions that change loose sediment to rock, replace one mineral with another, and convert peat to coal and organic matter to hydrocarbons, are all temperature dependent. These fluid-rock interactions are the realms of diagenesis and metamorphism. They all require heat (they also require water, but that is the subject of another article), and the only viable source of heat is Earth’s interior.
The strength of the lithosphere and asthenosphere are also strongly influenced by their thermal structure – in general, strength decreases with increasing temperature. Recall that one of the criteria for defining the lithosphere-asthenosphere boundary is the depth to the solidus (the 1300oC isotherm), below which there is partial melting and rock deformation by viscous creep.
Earth’s interior heat comes from two sources: remnant heat left over from consolidation of the solar nebula about 4.6 billion years ago, and radiogenic heat generated by radioactive decay of natural isotopes, mainly Uranium-238 and -235, Thorium-232 and Potassium-40. The former source is old heat; the latter is new. Radiant solar energy has a negligible influence on Earth’s internal heat flow.
Heat transfer
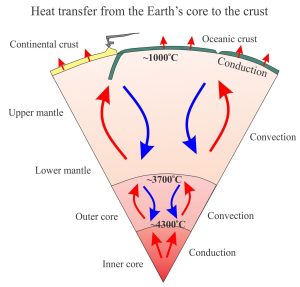
Heat must be transferred to the lithosphere and its sedimentary basins for any temperature-dependent process to take place. That heat ultimately comes from the core and deep mantle. There are two main kinds of heat transfer: conductive, and convective.
Conduction
Conducted heat is transferred by diffusion at the molecular scale, primarily from molecular vibrations. For an analogy, think of a hotplate on a BBQ where heat (from whatever source) is transferred to metal atoms; parts of the hotplate not directly exposed to the energy source will heat via this diffusive process.
Conduction is a relatively slow process in rocks, even at geological time scales. Conduction is important in the lower crust and mantle lithosphere. However, heat transfer in the upper crust, where porosity and permeability are significantly greater, also relies on convective and advective flow of fluids.
Convection
Convective heat flow requires the movement or transfer of mass. Convection is the primary mechanism for heat transfer in the mantle (convection does not occur in the lithosphere, hence the relative importance of conduction). It is generally imagined that mantle convection involves flow via viscous creep.
Convection can also occur via fluids through a porous and permeable crust; in this process only the fluids flow, not the rock mass. This kind of mass transfer is called advective flow. It takes place by flow through intergranular porosity, fractures and faults. Advective flow, and the heat it transfers, is singularly important for nearly all diagenetic reactions.
One of the more easily accessible examples of advective transport is groundwater flow in shallow aquifers. This is manifested as the delivery of dissolved solids (including contaminants) and heat along hydraulic gradients.
Geothermal gradients
Heat is measured in Watts or milli-Watts, and heat flow is expressed as milli-Watts per square metre (mWm-2). Heat flow can be measured in places where there is little disturbance from surface activities, such as deep mines. Despite temperatures in the core ranging from about 4300oC to 3700oC, little heat actually gets to Earth’s surface – the average is roughly equivalent to that generated by a 100-Watt light bulb over an area of 200 square metres. We do see localised, anomalous surface heat flow in geothermal (geysers, hot springs) and volcanic activity but the heat there is usually transferred via advective flow from magmas at depth.
Temperatures generally increase with depth below the surface; we can measure these temperature increases in mines and deep boreholes. The average geothermal gradient in the shallow crust is 2.5 – 3oC/100 m, but there is considerable variation depending on the proximity to subduction zones (where the geotherm is depressed by the down-going slab of cold oceanic crust), magmatic arcs and rifts that tend to be hotter, and cold intraplate settings. The gradient also tends to steepen with depth through the mantle lithosphere and asthenosphere, which means temperature increases with depth.
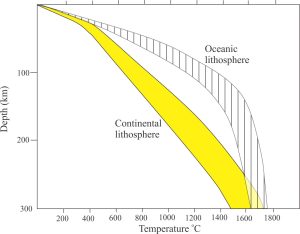
The geothermal gradients that we determine today are a snapshot in geological time. Lithosphere, once formed, will cool unless a new source of heat disturbs this general trend. Cooling results in a steepening of the geotherm. Examples of renewed heating include rifting of continental lithosphere, development of subduction zones and magmatic arcs, and the migration of mid-plate mantle plumes. One of the better-known examples of an evolving geotherm is the cooling of oceanic lithosphere.
Oceanic crust and lithosphere mantle begin life at spreading ridges where mantle plumes at shallow depth produce basaltic lava at the sea floor. With time, the newly formed lithosphere spreads outward from the ridge, cooling as it goes. The consequence of cooling is an increase in density and an increase in the depth of the solidus (the 1300oC isotherm), in other words an increase in lithosphere thickness. Both effects require isostatic compensation and the result is an increase in ocean water depth. All these changes are summarised in the following diagrams.

Paleotemperatures
The thermal structure of the lithosphere governs how it will respond to stress and, in the case of sedimentary basins, the limits of chemical diagenesis and metamorphism. For example, generation of hydrocarbons from organic matter generally begins at about 60o C and accelerates at 80o C; this temperature is commonly taken as a boundary condition for organic transformation. Likewise, metamorphic reactions are governed by temperature and pressure (as well as rock and fluid composition). The depth at which these reactions take place depends on the local geothermal gradient.
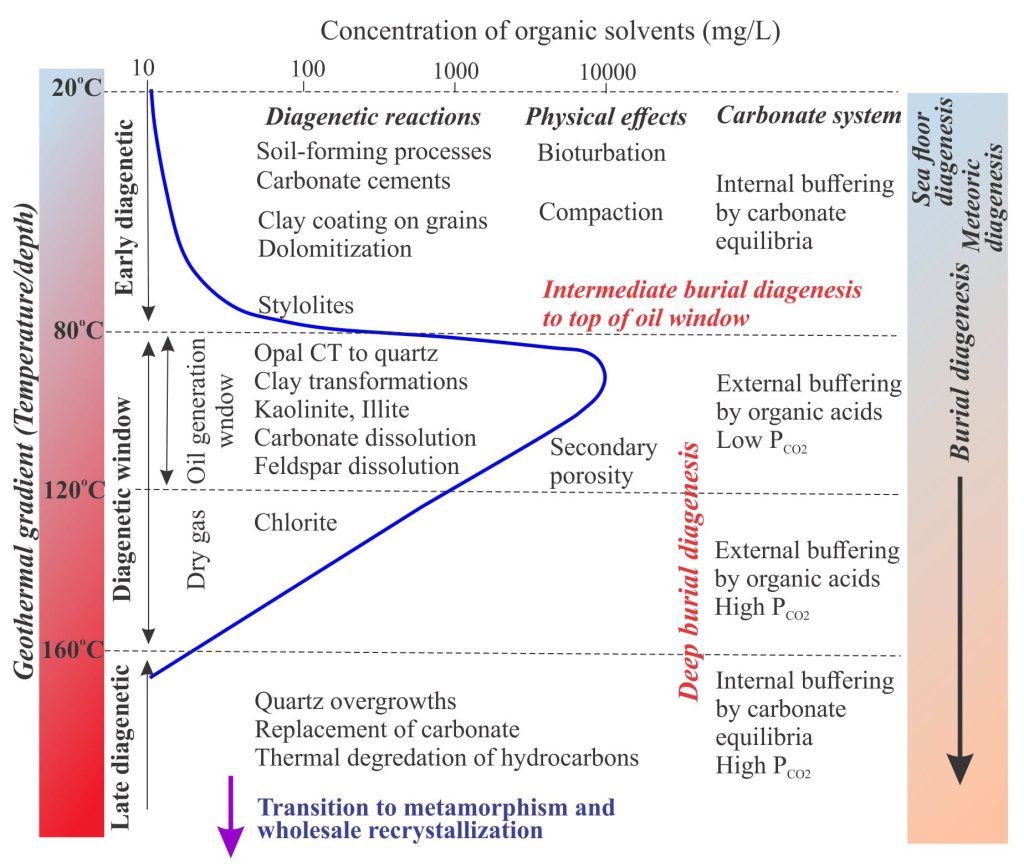
Our understanding of sedimentary basin evolution is greatly enhanced with measures of paleotemperature. Several geological tools are available that allow us to unravel the thermal history of rocks. These tools utilize paleothermometers that are components of rocks (such as minerals, isotopes, fossils, fluids) that provide us with either direct measures or proxies of paleotemperatures deep within the earth’s crust. Perhaps one of the better-known examples is the conversion of plant matter to coal where rank increases in concert with temperature and burial depth. A related method utilises the change in colour with temperature of pollen, spores, and fossils such as conodonts.
Other tools take advantage of microscopic fluid bubbles (inclusions) in crystals that represent not only fluid composition at the time of mineral precipitation, but their paleotemperatures – these fluid inclusion temperatures can be measured directly in thin sections. Another powerful tool that provides proxy measures of paleotemperature utilises fission tracks. Fission tracks form during radioactive decay of isotopes like Uranium-238, where the decay process damages the crystal lattice leaving a tell-tale track. Analysis of fission tracks (in apatite, zircon, and other minerals) is widely used to determine the age of rocks. However, the apatite fission track method is also useful for determining if and when sedimentary rocks reached a temperature of 110oC because at this temperature the tracks are annealed (the crystal defects are repaired). Again, the depth at which this occurs depends on the geothermal gradient.
Topics in this series
Sedimentary basins: Regions of prolonged subsidence
The rheology of the lithosphere
Isostasy: A lithospheric balancing act
Classification of sedimentary basins
Stretching the lithosphere: Rift basins
Nascent conjugate, passive margins
Basins formed by lithospheric flexure
Accretionary prisms and forearc basins
Basins formed by strike-slip tectonics
Allochthonous terranes – suspect and exotic
Source to sink: Sediment routing systems
