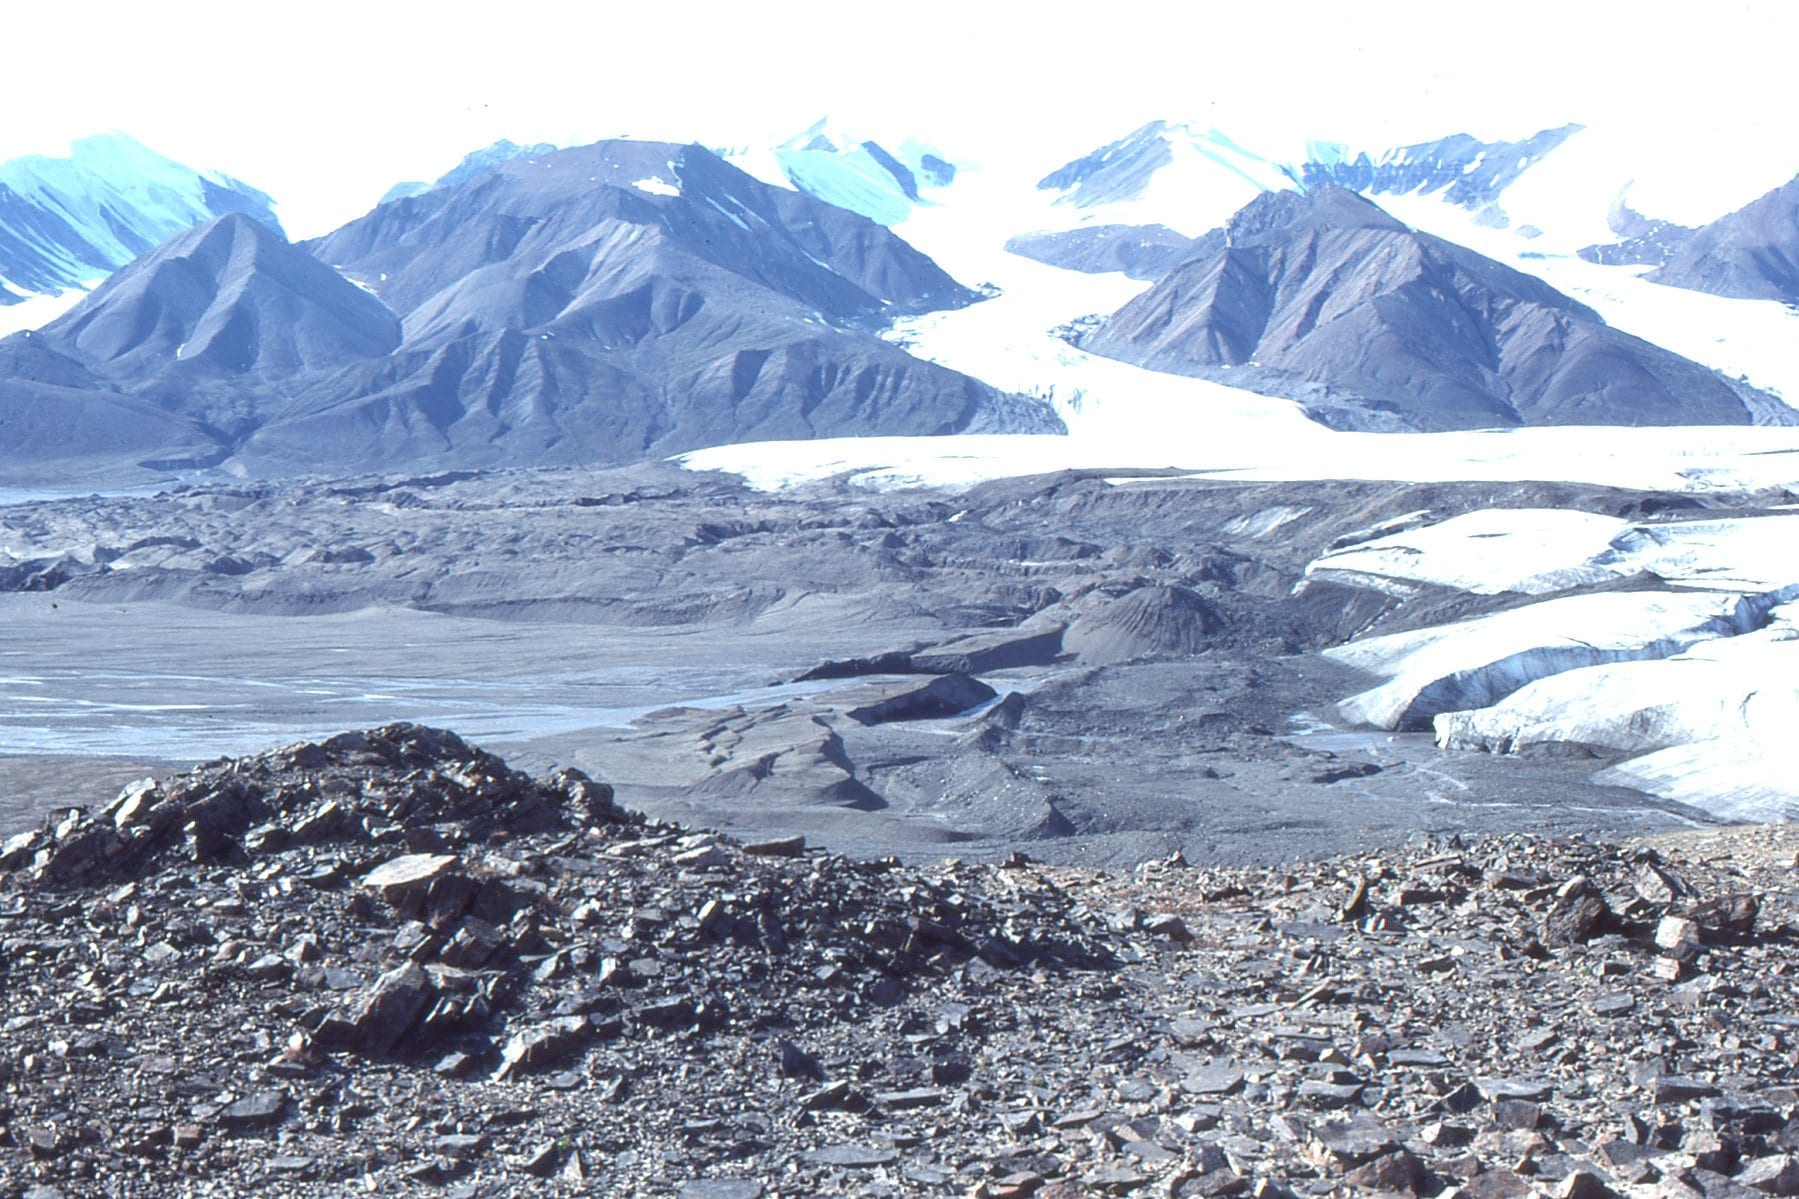
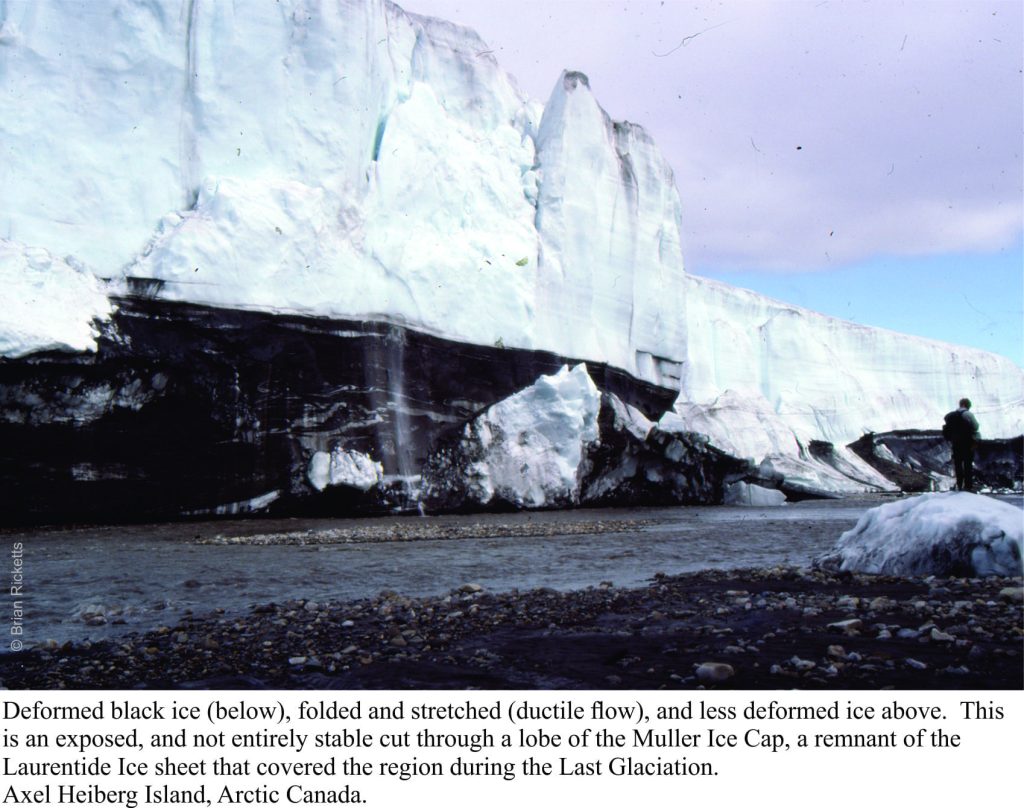
 Under the influence of gravity ice will flow or creep, albeit glacially. Stand in front of a glacier or the edge of an ice sheet and if you’re patient enough, you will see it creep, inexorably. It may take a while (days, months) but like I said, be patient. Bits of ice may fall off the front (calve) but that’s more the product of gravitational instability and weakness at the exposed ice edge. If it wasn’t for the propensity to flow there would be no glaciers, and ice sheets would stand still.
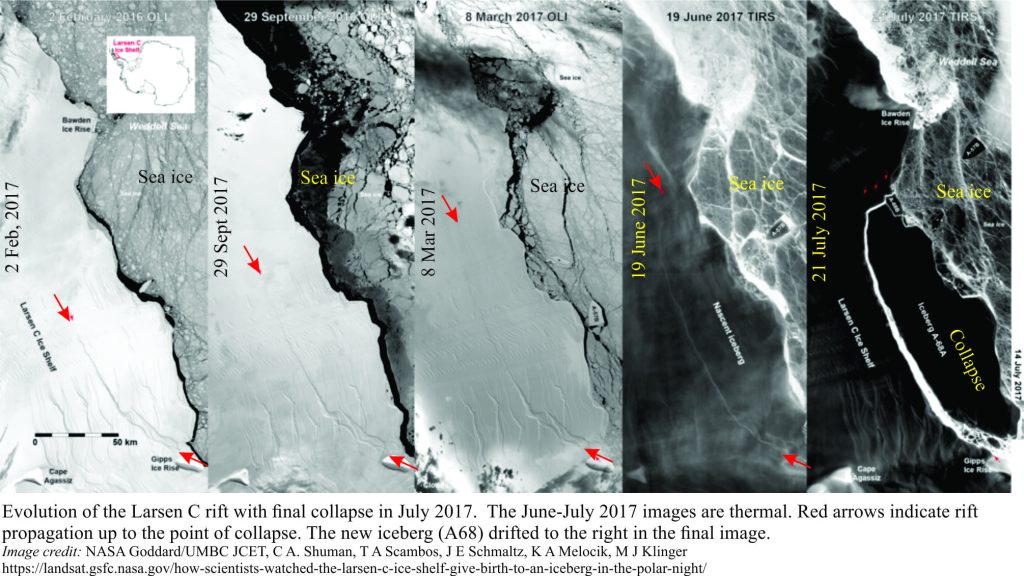
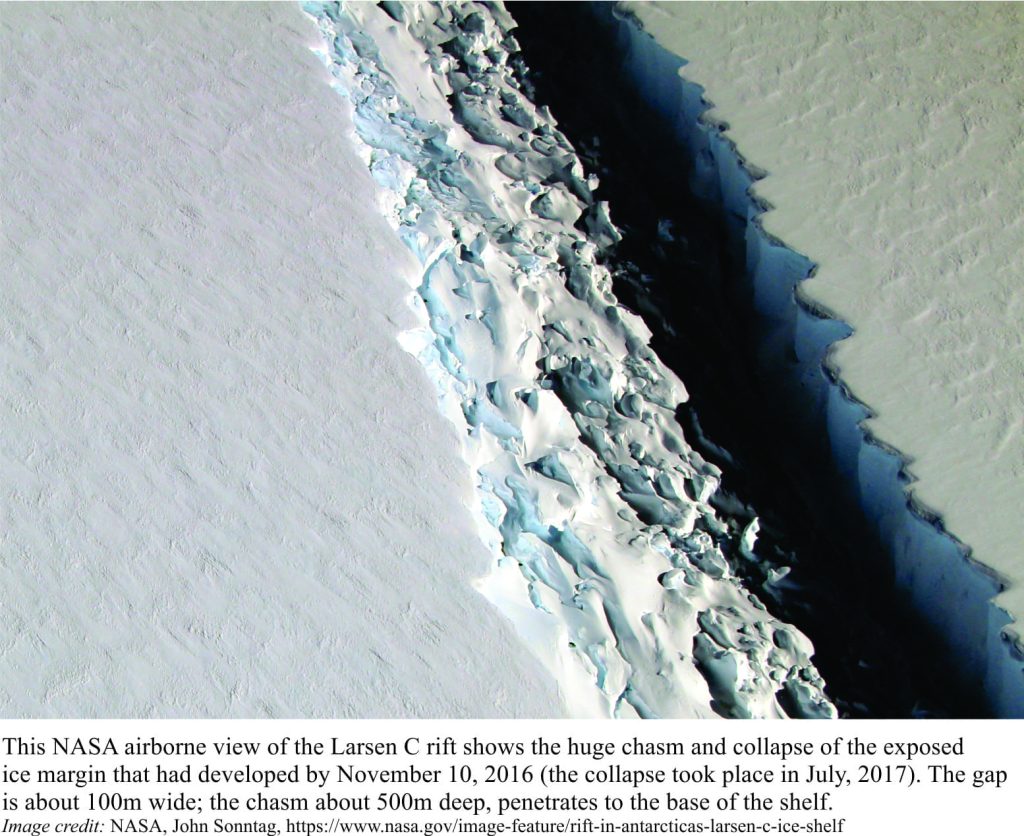
Antarctic ice shelves, those thick, floating wedges and platforms of ice, are a direct consequence of ice flow. One of them, Larsen C, has been in the news of late because a very large chunk (5800 sq. km), broke off and floated away as an iceberg; the inevitable comparisons have the new iceberg (imaginatively named A68) as twice the size of Luxembourg or about the size of Delaware. The Larsen C collapse took place in July 2017 during the polar winter, thus requiring thermal images; scientists had to wait for the summer sun to rise before getting a first-hand view of the new iceberg.
Ice shelves are commonly 10s, even 100s of metres thick. They are firmly attached to the Antarctic ‘mainland’. Their longevity is counted in 100s to 1000s of years (dated using ice-core samples). They have a degree of permanency that is quite different to the much thinner and more seasonal sea-ice (also in the news because it appears to be disappearing at an alarming rate). The Antarctic coast boasts 15 sizeable ice shelves of which the Ross and Ronne-Filchner shelves are the largest at more than 400,000 sq. km; Greenland and Ellesmere Island have a few smaller examples. Ice shelf calving, like the more familiar glacier calving is a normal process where chunks of ice fall off the shelf edge cliffs because the ice tends to be weakened by melting, fracturing and sea wave vibrations.
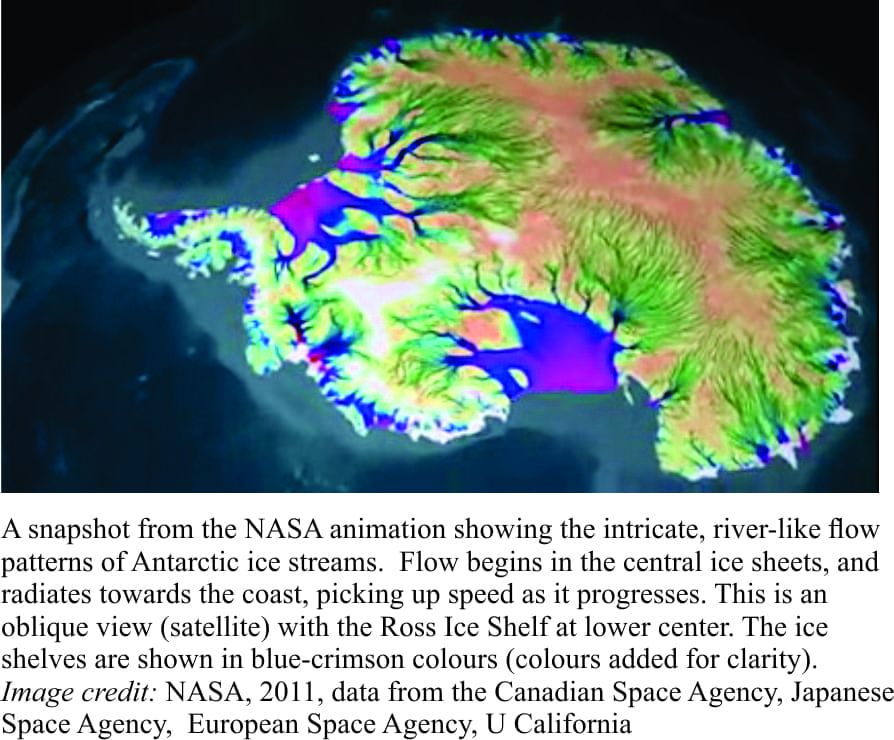
Antarctic ice shelves are inextricably linked to the much larger and thicker Antarctic ice sheets. In fact, ice flowing from the ice sheets feeds the shelves directly via glaciers and ice streams. Ice in the thick, central parts of Antarctica flows at a sedate few metres to 10s of metres per year. In marked contrast, ice streams are narrow, river-like ribbons of fast-moving ice (up to 50km wide), where flow can exceed 1000m/year. In general, the ice stream speeds increase towards the coast. Most of the floating ice shelves are fed by ice streams. The image below shows a complex network of ice streams across the continent – the link takes you to a NASA animation of ice stream flow.
The relationship between ice shelves and the massive ice sheets is dynamic, which means that whatever happens to one will potentially affect the other. The ice shelves form an effective buttress to the ice sheets and to glacier and ice stream flow – remove the buttress and the glaciers will flow more rapidly towards the coast. Floating ice shelves do not contribute to changes in sea level when they melt, but an increase in the flow of ground-based ice sheets and glaciers into the sea will contribute to sea level rise. The recent collapse of Larsen C ice shelf has highlighted this problem.
Under normal conditions, the amount of ice added to an ice shelf by ice streams and glaciers is roughly balanced by ice calving and melting. Melting occurs at the surface and at the submerged contact between the ice and seawater. An increase in air or water temperatures will upset this balance and thin the shelves. Coincidentally, tides may cause a shelf to bend resulting in fractures; fractures that drain surface melt-waters will exacerbate melting at depth. The result is a weakening of parts of a shelf to the point of collapse.
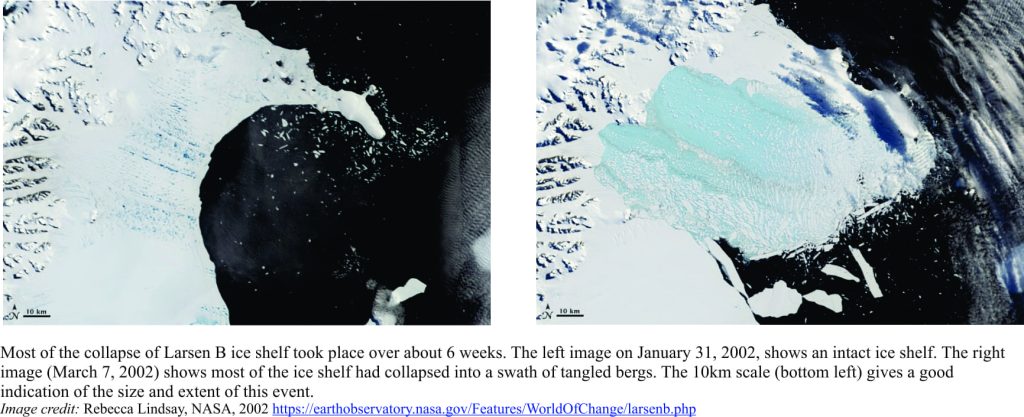
Although Larsen C ice shelf has had top billing, seven additional ice shelves have also collapsed in the last 30 years. Collapse of Larsen B in 2002 took place over about 6 weeks. Satellite imagery and altimetry subsequently showed that the speeds of ice flow in 4 glaciers that feed into Larsen B had increased 2 to 6 times previous flow rates. This has been attributed to a significant decrease in the buttressing effect by the former ice shelf – most of the shelf disappeared during this event. Similar increases in ice stream-glacier flow were also observed following the 1995 collapse of Larsen A. Both shelves collapsed during a period of increased surface warming and formation of melt-water ponds.
Our understanding of the link between ice shelf collapse (at least those over the last 30 years) and climate change is still nascent. Ice shelf collapses have occurred many times in the past – they are a natural response to changing ice balance among the Antarctic ice sheets, glaciers, ice streams, and the ice shelves themselves. Studies of the Larsen ice shelf events have clearly shown how delicate this balancing act can be. Whether the spate of collapses since 1989 is part of a trend has yet to be determined with confidence, despite the hyperbole of some media outlets. However, there is growing evidence for changes to ocean temperatures, that inevitably will also affect currents and heat exchange between tropical and polar ocean water masses. Even subtle changes in water temperature beneath the ice shelves would have a significant impact on melting and therefore, shelf destabilization. Continued monitoring and research of these polar systems is probably a good idea.
For related posts, check out: Polar bears do not live in the antarctic; there are no penguins in the arctic: the asymmetry of the poles
Sea level change; busting a few myths
Addendum: Ice flows from topographic divides to the coast and ice-shelves at rates varying from more than 1000m/yr to <10m/yr. A new map of ice flow vectors at much greater resolution than the one shown in the post above, was published in 2019. The new data is based on satellite radar, and can resolve to velocities to 10s of cm/year. You can access the publication here.
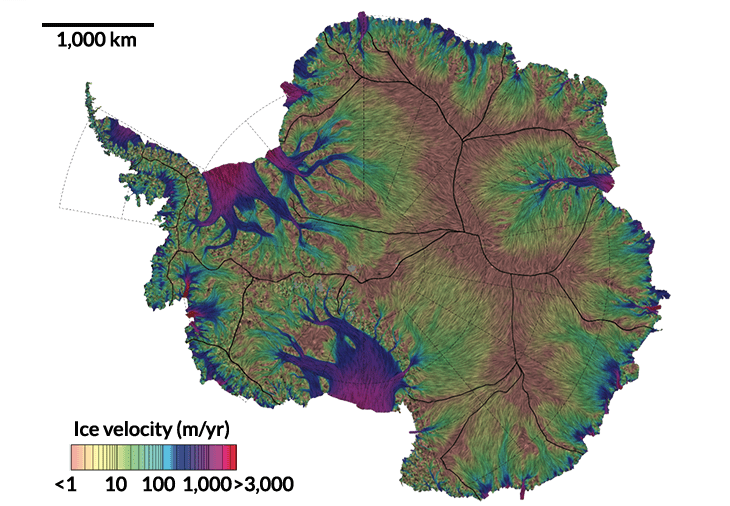
J. Mouginot, E. Rignot and B. Scheuchl. Continent-wide, interferometric SAR phase, mapping of Antarctic ice velocity. Geophysical Research Letters. Published online July 29, 2019.
