Stratigraphic trends in outcrop and core, and the role they play in identifying parasequence stacking patterns.
Recognition of stratigraphic trends, in outcrop, core, and wireline logs, lies at the heart of stratigraphy, in all its guises. We can define a stratigraphic trend as the relatively ordered (i.e. non-random) vertical and lateral changes in bed geometry, sediment composition, sedimentary structures, and fossil – trace fossil content. Stratigraphic trends are found at all geological scales, from a few centimetres to 1000s of metres, but it is at the scale of an outcrop or length of core that we are first likely to encounter them. Stratigraphic trends inferred from sedimentary facies include:
- Changes in grain size that give rise to coarsening- or fining-upward
- Changes in bed thickness.
- Changing proportions of mudstone, siltstone, sandstone, conglomerate, or changing bioclast content.
- Trace fossil assemblages that represent transitions in behavioural activity with changing environments.
- Changes in bedform size and abundance.
All these facies trends inform our interpretations in terms of:
- the hydraulic conditions required to move sediment and create bedforms (e.g. mud from suspension versus sand by bedload transport; or ripples versus large tabular crossbed sets),
- the availability of sediment,
- The living conditions for resident biotas, and, importantly,
- The change in relative water depths, for example, hummocky crossbeds that indicate storm wave-base, versus indicators of tidal currents across the upper shoreface, or desiccation structures that indicate exposure.
Together, these criteria will (hopefully) tell us that the stratigraphic trend records a period of shallowing or deepening upward conditions, or situations where there is no change in water depth.
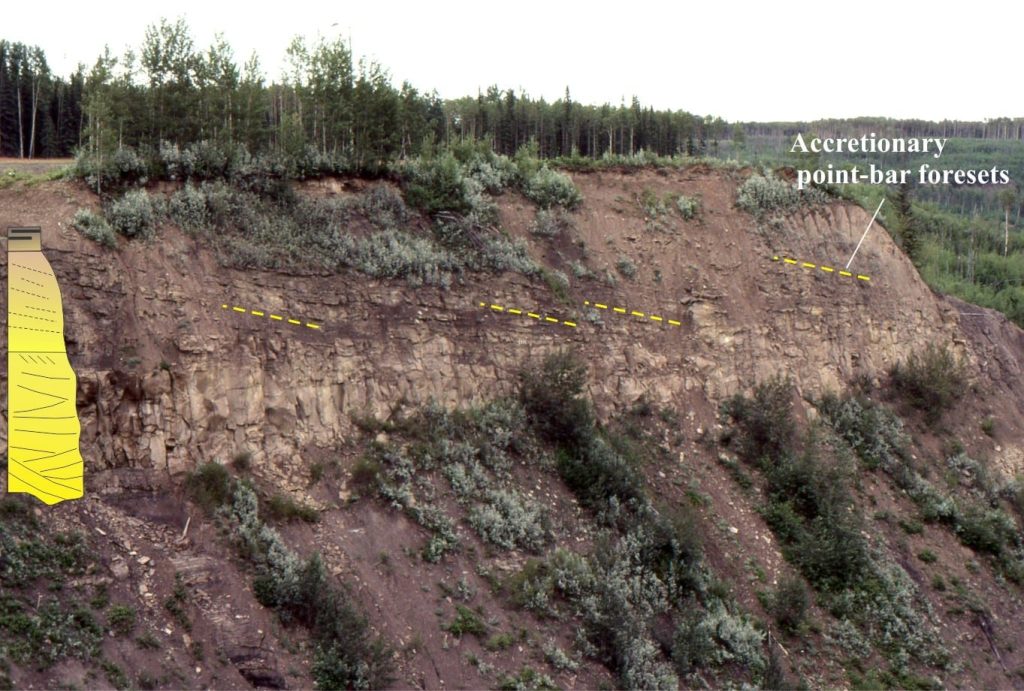
Stratigraphic trends are common in non-marine and marine depositional systems. Well known examples include classic fining-upward fluvial point-bar successions, coarsening- upward delta lobes, intertidal, shelf, and platform parasequences, and fining upward peritidal carbonate successions. They may also be present as coarsening or fining upward units associated with some submarine channels and fan lobes.
In shallow marine settings, the most common outcrop-scale stratigraphic trends develop as upward-shallowing successions that accumulate via progradation, aggradation, or a combination of the two, depending on the rates of change of baselevel, sediment accommodation and sediment supply. The standard sequence stratigraphic parasequence schema equates these depositional trends with transgressive and regressive stages of 4th or 5th order sea-level cycles – or parasequences. However, it is also generally acknowledged that parasequence-scale successions also develop from autogenic processes not directly associated with sea level fluctuations. Hence, a note of caution – don’t assume that all parasequences, or any other similar-scale stratigraphic trends, are associated with changes in baselevel.
Stacking patterns
The creation of sediment accommodation over periods on the order of 106 years is controlled primarily by basin subsidence, upon which other allogenic and autogenic processes are superimposed, including higher-order sea level cycles. The resulting stratigraphic successions may present a degree of cyclicity, particularly in shallow marine settings, but some successions are not obviously cyclic – thick turbidite successions commonly fit into this category. Cyclicity is central to standard sequence stratigraphic schemes, and in this context parasequences are important because their stacking geometry, or stacking patterns are regarded as indicators of changes to baselevels, sediment accommodation, and sediment supply over these time scales. Parasequence stacking patterns also record shoreline trajectories.
The most common stacking patterns record long-term progradation, aggradation, and retrogradation. The examples below are presented in common sequence stratigraphy notation, and the shoreline trajectory classes of Helland-Hansen and Hampson (2009).
Progradational: Late Paleocene river-dominated delta lobes, Axel Heiberg Island
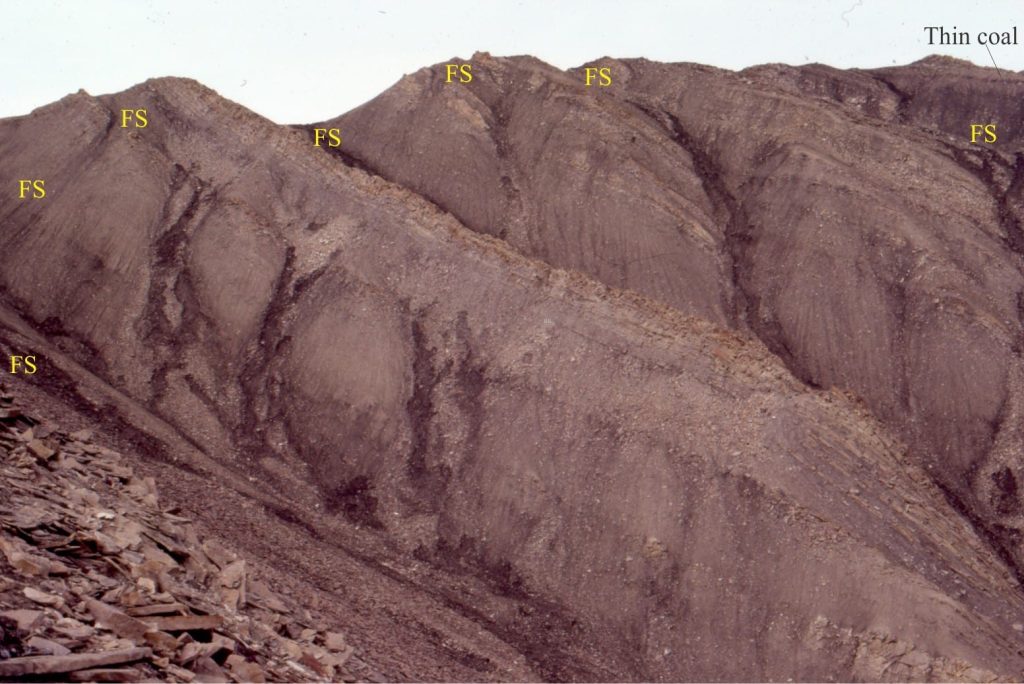
Each parasequence in this Late Paleocene stack accumulated as a delta lobe, coarsening-upward from prodelta mudstone, to distributary channel and bar sandstones; Each is bound by a flooding surface (FS). Visible section thickness is about 300 m. The stacking pattern is characterized by:
- An increase in the proportion of sandstone towards the top of the stack.
- An increase in the proportion of crossbedded sandstone towards the top,
- There is a thin carbonaceous mudstone with root structures in the uppermost parasequence; thin coals become more common in parasequences higher in the succession (beyond this view). These lithologies represent vegetation, soil development, and overbank mud deposition on successive delta plains and marshes.
When we come to interpret stratigraphic trends in an outcrop like this, we need to remember that the stratigraphic section represents a particular paleo-location in the old sedimentary basin. It’s a bit like imagining yourself standing on the ancient sea floor and witnessing the overhead accumulation of successive beds. In this example, the pattern of facies from one parasequence to the next indicates a shift from relatively deep, to relatively shallow conditions, the latter being somewhere on the old delta plain. In other words, the coarse-grained facies at the top of each parasequence become progressively shallower. The stacking pattern is interpreted as progradational.
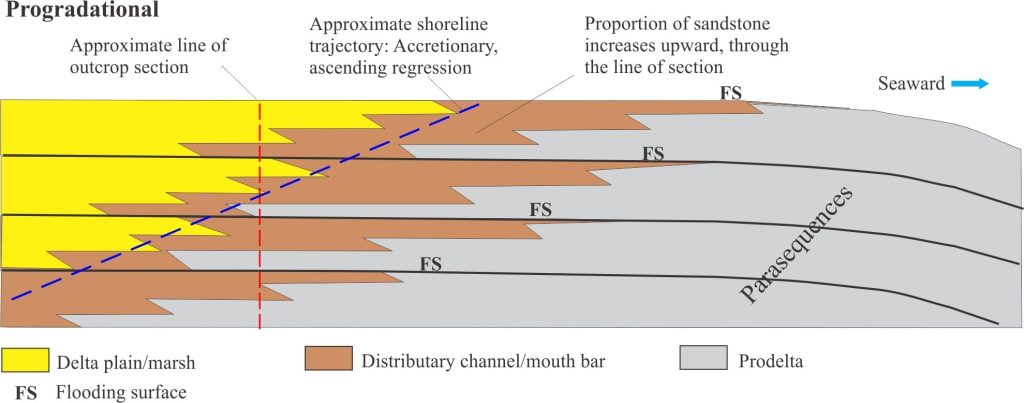
We can also think of this transition in terms of shoreline transits; at the base of the stack the paleoshoreline is landward of our observation point, and at the top, it has passed over our head, i.e. the shoreline trajectory is accretionary, ascending regression.
Progradation is promoted by sedimentation rates that keep pace with, or slightly exceed the generation of accommodation. This tends to occur during the normal regressive stages of relative sea level fluctuation.
Degradational: Mid-Late Paleocene sharp-based sandstone wedges, Axel Heiberg Island
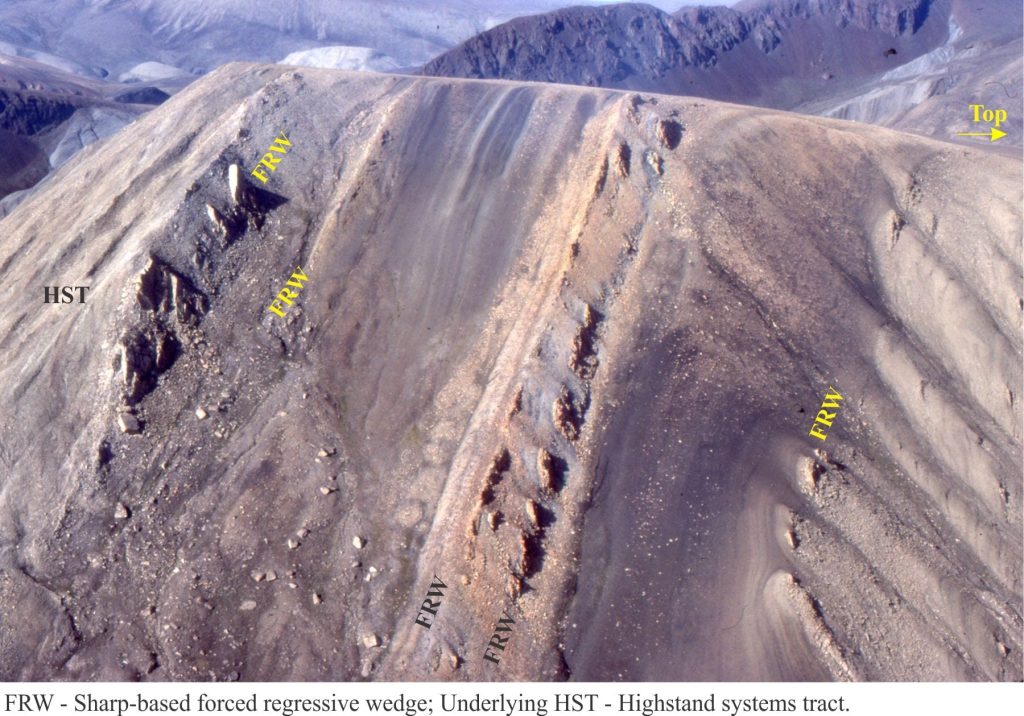
This category of depositional trend is a variation on the progradation theme.
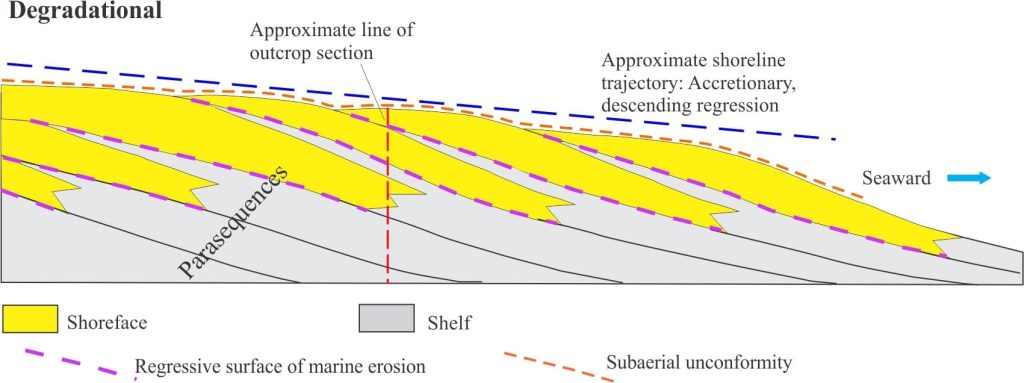
Sharp-based, crossbedded sandstone parasequences in Mid-Late Paleocene example are sandwiched between outer shelf mudstones. The sandstones bear the hallmarks of upper shoreface deposition with abundant planar and trough crossbeds, scours, and pebble lags. Each sandstone package is bound by a scoured base interpreted to be a regressive surface of marine erosion (RSME), and an abrupt upper contact interpreted as a flooding surface. The RSME develops via the erosive power of waves across the upper shoreface as relative sea level falls. The RSME will potentially remove some of the underlying shoreface deposits.
Each parasequence represents a brief period of shoreface progradation where the overlying sandstone wedge down-steps, in a seaward direction, the preceding parasequence. Thus, each sandstone wedge is ‘forced’ seaward by the falling baselevel and negative accommodation. Therefore, the overall degradational depositional trend is a response to forced regression; the shoreline trajectory class is accretionary, descending regression.
Standard sequence stratigraphy expects that a subaerial unconformity will traverse and partly erode the top of the down-stepping stack of sandstones.
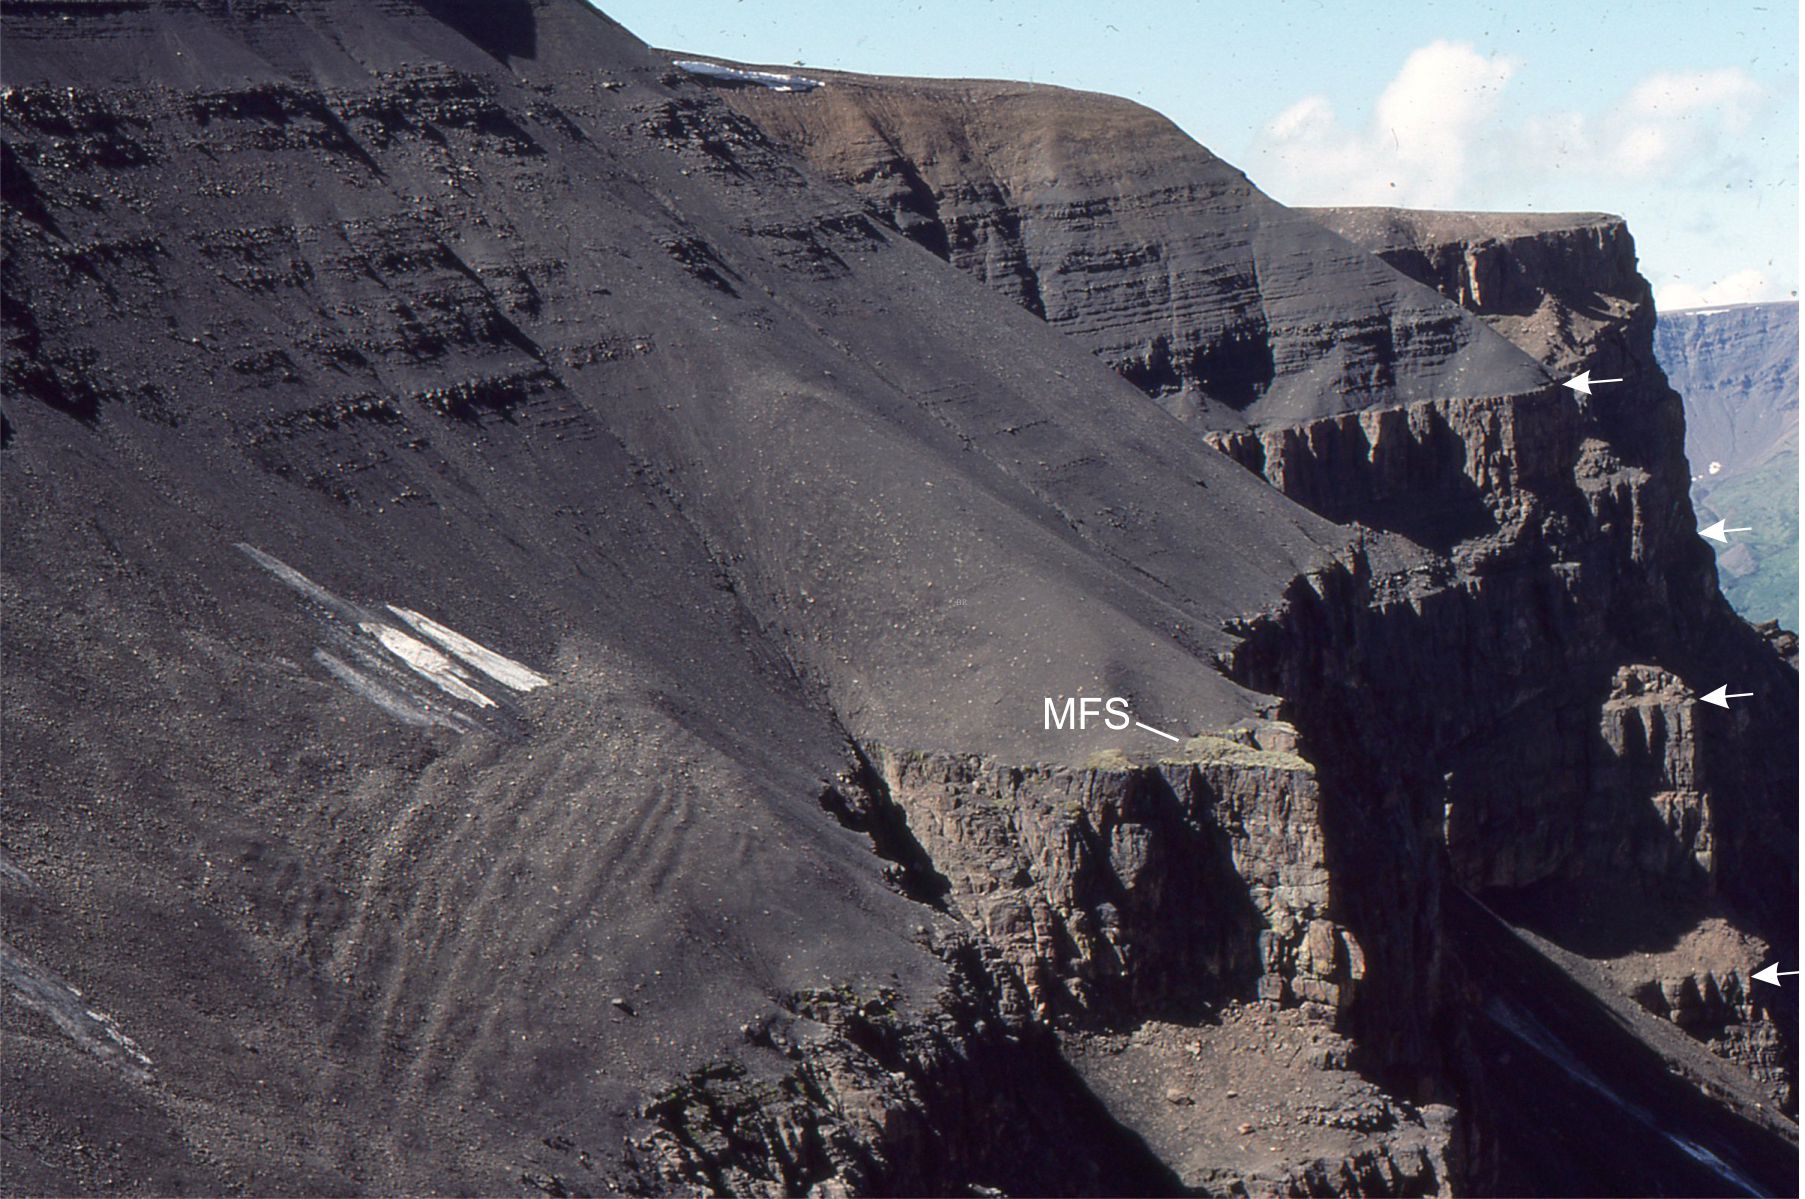
Aggradational: Mid-Jurassic shelf parasequences, Bowser Basin, British Columbia
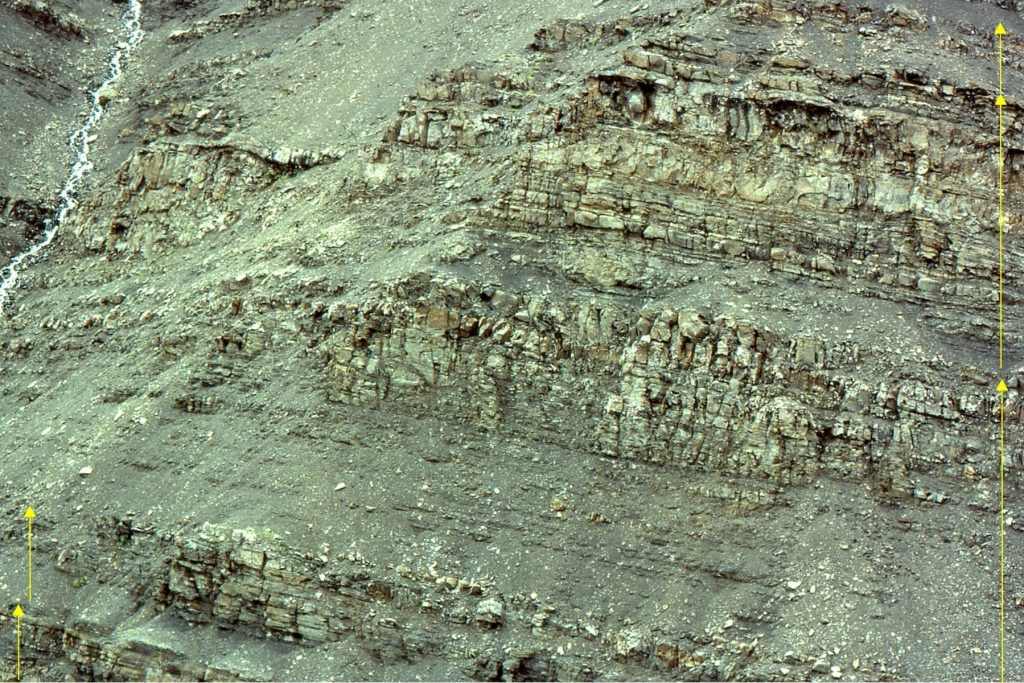
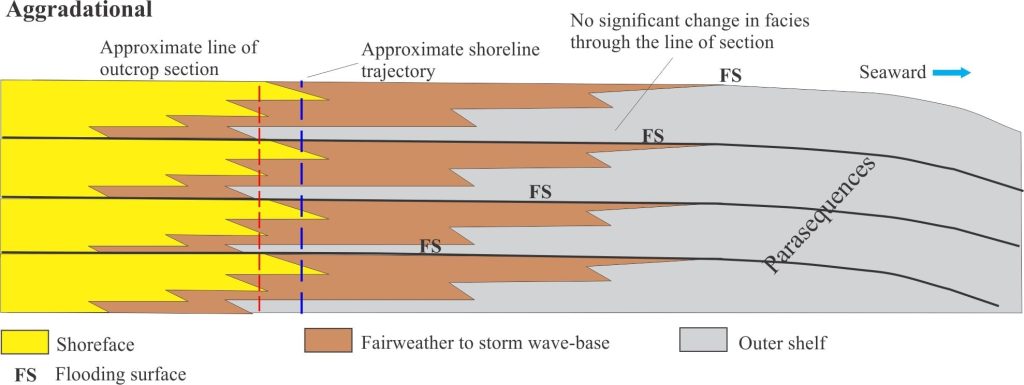
If, in our sea floor immersion analogy, we witness the accumulation of successive parasequences where facies associations are relatively constant from one cycle to the next, then there is no appreciable landward or seaward shift in the position of the shoreface, shoreline, or delta lobe. Sequence stratigraphers refer to this as aggradation and attribute it to the condition where sediment supply greatly exceeds the generation of accommodation during normal regression. The corresponding shoreline trajectory is accretionary ascending regression ( ascending at a high angle).
The fundamental difference between progradation and aggradation lies in the relationship between sediment accommodation and supply. These two depositional trends can be thought of as end members of a continuum where the relative proportion of each varies through time (stratigraphically) and along depositional strike – the latter caused by variations in sediment supply depending on proximity to major rivers or elevated topography. Thus, it is possible for aggradation to morph into progradation. Allogenic conditions that might force this transition over periods on the order of 106 years include:
- Accelerating or decelerating rates of baselevel change during a cycle of relative sea level (and therefore accommodation).
- Changes in fluvial sediment supply caused by changing baselevel.
- Changes in sediment supply due to uplift and erosion of the source area, independent of baselevel changes.
Retrogradational: Mid-Late Paleocene mudstone dominated parasequences, Ellesmere Island
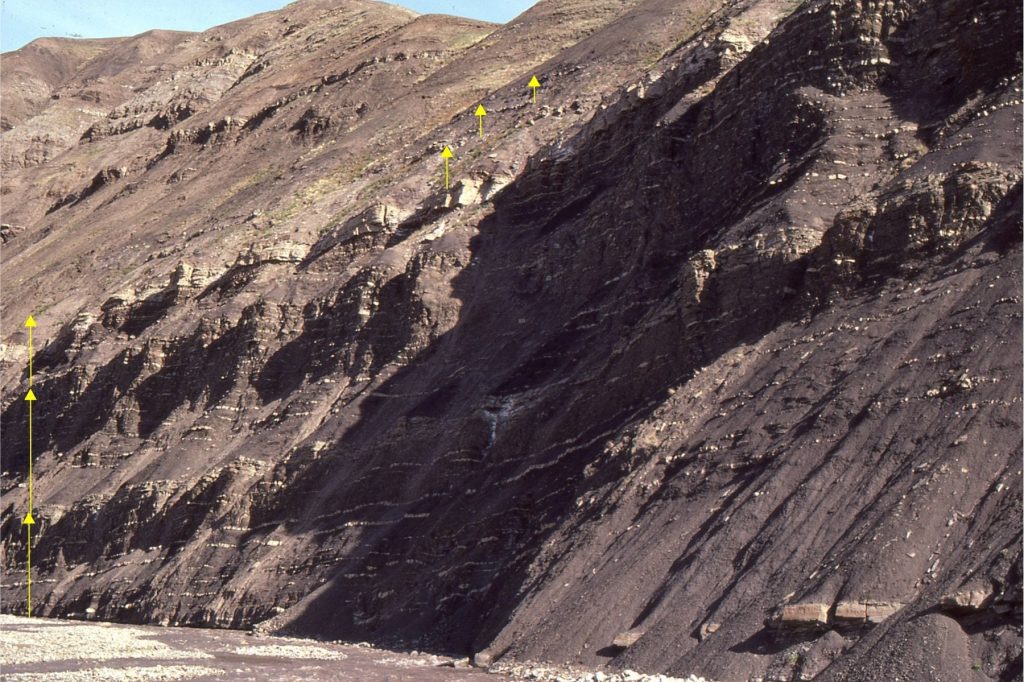
During transgression, there tends to be a reduction in sediment supply coincident with an increase in accommodation. In response, parasequences tend to show the following characteristics:
- Parasequences coarsen-, or shallow-upwards, much like their counterparts in progradational and aggradational successions; they are bound by flooding surfaces.
- The proportion of coarse-grained facies decreases in successive parasequences, replaced by greater proportions of mudrock.
- Parasequences may consist entirely of mudstone-siltstone if the supply of sand decreases significantly. In situations like this, the identification of key stratigraphic surfaces can be difficult. Criteria that might assist here include:
- Hardgrounds (preferentially cemented by calcite or phosphate) beneath a flooding surface.
- Trace fossil omission surfaces (unique hardground trace fossil assemblages).
- Abundant glauconite, or high organic carbon content below flooding surfaces.
- Borehole wireline logs, particularly gamma logs, will respond to increased concentrations of radiogenic potassium (in glauconite), uranium and thorium (in clays).
The overall stacking pattern indicates that the shoreface and shoreline move landward. The shoreline trajectory is accretionary and retrogradational.
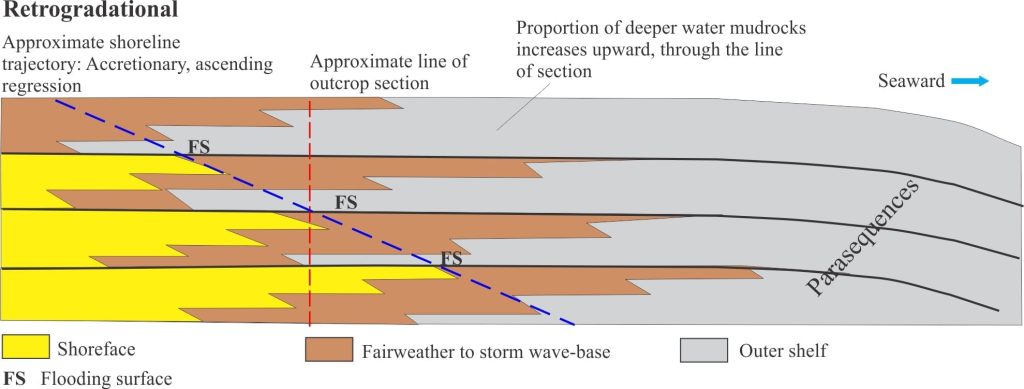
It is worth reiterating that, despite the overall transgressive trend, each parasequence represents a relatively short-lived period of progradation.
Note too that retrogradation may be offset in conditions where sediment supply keeps pace or exceeds rising relative sea levels. This situation can occur across narrow shelves close to tectonically active source areas.
This post is part of the How To…series on Stratigraphy and Sequence Stratigraphy
Other posts in this series on Stratigraphy and Sequence Stratigraphy
Stratigraphic surfaces in outcrop – baselevel fall
Stratigraphic surfaces in outcrop – baselevel rise
A timeline of stratigraphic principles; 15th to 18th C
A timeline of stratigraphic principles; 19th C to 1950
A timeline of stratigraphic principles; 1950-1977
Baselevel, Base-level, and Base level
Sediment accommodation and supply
Autogenic or allogenic dynamics in stratigraphy?
Stratigraphic cycles: What are they?
Sequence stratigraphic surfaces
Shorelines and shoreline trajectories
Stratigraphic condensation – condensed sections
