This is the first of three posts on tempestites:
2 Storm surges and tempestites
3 Evolving tempestite lithofacies models
The response of coastal waters to storms is driven primarily by wind shear, Coriolis forces, Ekman veering, and geostrophic flows.
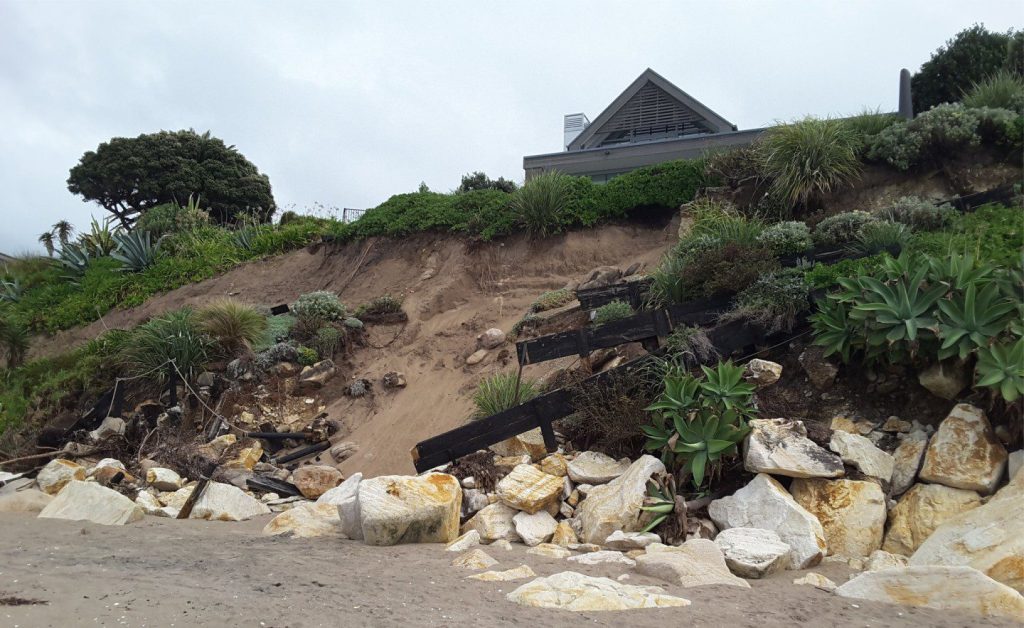
Storms can wreak havoc almost anywhere on Earth. Wind and water are capable of changing coastlines and the course of rivers, or moving bits of the landscape to places we’d rather they’d not be. The natural mayhem of the natural world.
Coasts frequently bear the brunt of such maelstroms – the destructive energy of oversized waves pushed landward by surging water masses. And if luck and fortune have completely abandoned you, the level of destruction will be exacerbated by peak tides.
The movement of oceanic water masses, whether conditions are clement or inclement, depends on several factors:
- Wind shear generates currents and turbulence to depths of about 100 m.
- Semidiurnal tides.
- Thermohaline effects where differences in temperate and salinity produce deep circulation.
- The transit of high and low air-pressure systems, and periodic events like the El Niño – Southern Oscillation (ENSO).
- Geostrophic currents, and
- Coriolis forces.
Coastal storm surges involve only shallow water masses, so deep thermohaline effects can be neglected. Tides have the potential to exacerbate onshore storm surges, but they are not a factor in their development. That leaves wind shear, weather systems, geostrophic currents, and the effects of Coriolis forces as important contributors to the formation of coastal storm surges.
Coriolis effects
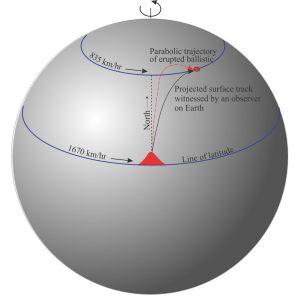
The analogy commonly used to explain the Coriolis effect involves lobbing an artillery shell over the surface of the Earth. We’ll use a more benign analogy of a ballistic rock lobbed from an erupting volcano at the equator.
Earth rotates eastward about a north-south axis which means that the linear velocity at Earth’s surface varies with latitude because different locations need to travel at different rates over a 24 hour solar day. The eastward velocity of a point at the equator is 1670 km/hour (the point has farthest to travel over the period of rotation), and zero at the rotation pole. The velocity at 30o N is 1446 km/hour, and at 60o N about 835 km/hour. Thus, the reduction in velocity for latitudes 60o N to 90o N is significantly greater than from the equator to 30o N.
Our fictitious volcanic ballistic moves due north through a parabolic arc. If we observe the ballistic flight from the volcano (our frame of reference), then in addition to its northward linear velocity, it also has an initial west-to-east velocity of 1670 km/hour. However, the point of impact (north) is moving at a slower speed than at the equator, which means that, rather than landing at a point due north of the volcano, the ballistic will be deflected east, or to the right. Furthermore, the surface projection of the ballistic trajectory is a curved line. This deflection is called the Coriolis Effect, named after the French mathematician Gaspard Gustave de Coriolis (1792-1843) who theorized about forces and energy associated with revolving wheels. The opposite dynamic would occur if the volcano was located north of the equator and tossed its piece of rock due south – its initial west-east velocity would be less than 1670 km/hour but it would impact a point on the equator moving at 1670 km/hour. The rock and its trajectory would be deflected to the west (but still to the right of an observer at the volcano).
For an observer on our rotating Earth, the moving volcanic ballistic has two velocity components:
- Linear velocity (V) that is orthogonal to the axis of rotation and, as noted above is greatest at the equator and zero at the poles of rotation. It can be represented as a vector.
- Angular velocity (ω) which is measured as the rate at which the angular motion changes about the rotation axis (the formula below requires this to be expressed as radians/second). The value of ω is the same at the equator and the poles. ω can be represented as a north-directed vector along the rotation axis and at right angles to V – the vector is usually designated as Ω.
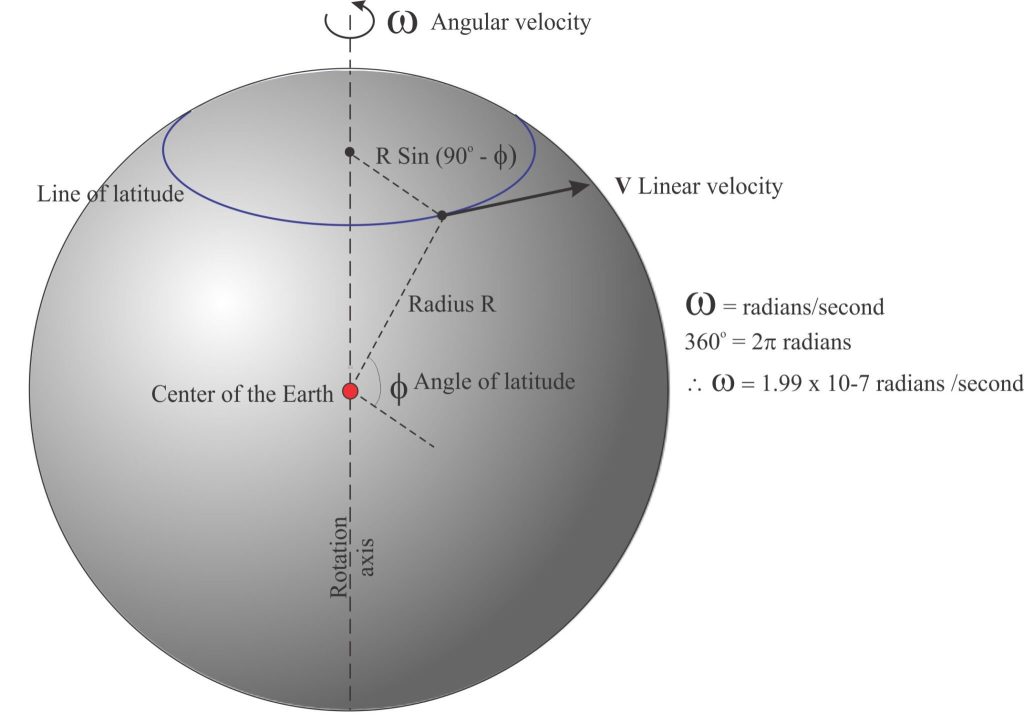
The diagram above shows how the linear velocity V at a point on the surface can be written in terms of the angular velocity ω (radians/second), Earth radius R, the latitude angle ϕ, and where the component R.sin(90∘−ϕ) is orthogonal to the rotation axis. If ω is measured in radians then:
V = ω.R.sin(90∘−ϕ) and as noted above
When ϕ = 90o at the poles, the velocity is zero.
Newton’s Second Law applies to systems where forces are not balanced and is written as
F = m.a where m is the body mass and a its acceleration. In this case F is the net force. The Coriolis Force is usually expressed as:
FCoriolis = -2m (Ω x V) where m is the object mass.
Here, the term (Ω x V) is a vector cross-product that applies when the two vectors are orthogonal and independent (i.e., the term (Ω x V) is NOT a simple multiplication). The cross-product term (Ω x V) is called the Coriolis acceleration that is also a vector with a magnitude 2vω.sinϕ (see John Southard’s explanation in the link above). The Coriolis force FCoriolis is orthogonal to both ω and V (using a standard three-dimensional coordinate system).
In the diagram above, the angle between the point on the Earth surface and the rotation axis (ϕ) corresponds to the latitude. If we consider the expression for the magnitude of the Coriolis acceleration (2vω.sinϕ) we see that the Coriolis force F increases towards the poles because the value of ϕLatitude increases (Sin90o = 1). FCoriolis is zero at the equator because ϕLatitude is zero and the Coriolis acceleration is therefore zero.
In summary:
- We generally consider the horizontal component of FCoriolis because it has the greatest influence of air and water masses.
- FCoriolis is orthogonal to the direction of movement such that –
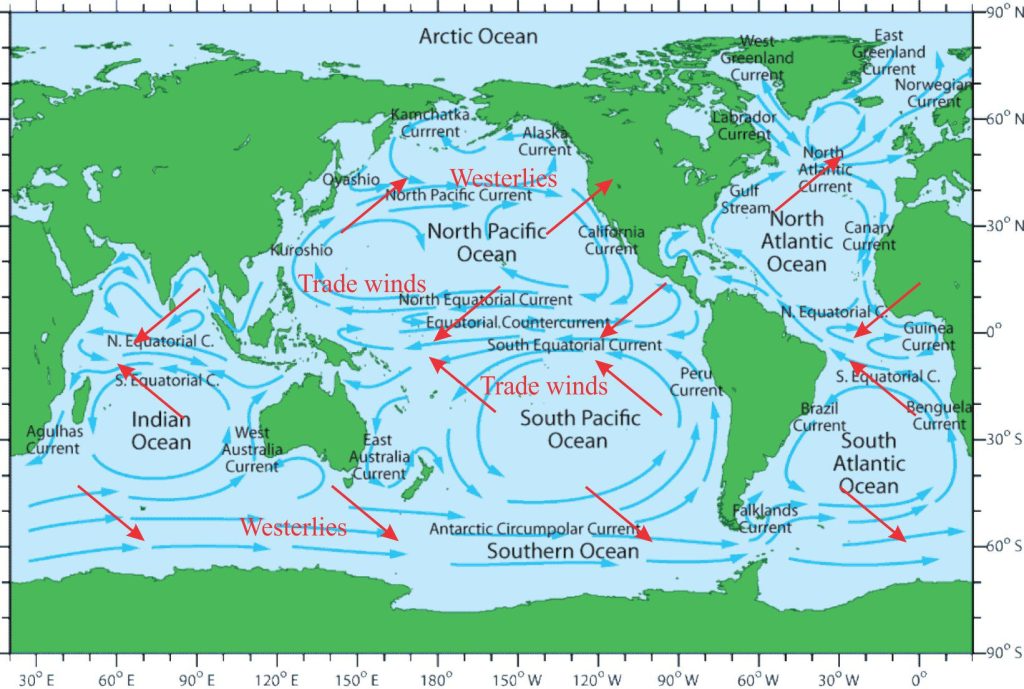
- Coriolis deflections are to the right of the direction of forward motion in the northern hemisphere, and to the left in the southern hemisphere. These deflections apply to ocean water masses (gyres), and to weather systems like the Roaring Forties, tropical cyclones and hurricanes.
- FCoriolis is directly proportional to both the linear velocity and the mass. In reality, the numerical value of FCoriolis is small and we only see the Coriolis effect on large bodies, such as ocean water masses and atmospheric circulation cells (F is too small to affect bath water going down the plughole).
- Coriolis effects increase towards the poles of rotation and are zero at the equator.
Ocean gyres
There are five major circulation cells, or gyres in our modern oceans (plus several smaller circulation cells). Currents in the upper 100-200 m or so of these vast water masses are generated by prevailing winds although only about 2% of the wind energy is transferred to ocean waters; the direction of current flow is the same as these winds. However, the surface flow of these gyres is also affected by Coriolis forces that are manifested as a deflection that on average is about 45o. Circulation in the North Pacific and North Atlantic gyres is deflected to the right, resulting in clockwise flow, and for their southern counterparts, deflection is to the left such that the gyres flow anticlockwise. The weakness of Coriolis forces near the equator is reflected in some of the more complex flow patterns there. The Equatorial Countercurrent between the North and South Pacific gyres is a good example where gravitational forces are significantly greater than Coriolis Forces resulting in a reversal of flow. The other major circulation system is the Antarctic Circumpolar Current that flows unimpeded as it encircles Antarctica; this current forms the southern boundary to the southern Pacific, Atlantic, and Indian Ocean gyres.
Ocean gyres have probably existed for as long as there have been ocean water masses (>4 billion years). However, the location and size of the paleo-gyres would have been different to the modern forms because of shifting continental and ocean margins (plate tectonics), and waxing and waning of polar ice sheets (Lionel Carter has given us a nice summary of some of the changes over the Pleistocene-Holocene glaciations).
Ekman spirals
The velocity of wind-generated surface water currents varies with depth, depending on factors such as the depth of wave orbital motion and the degree of turbulence that also diminishes with depth. The Coriolis deflection of the uppermost waters is about 45o. Friction between this layer and waters of lower velocity immediately beneath it results in the second layer being dragged in the same direction, although the deflection is less because of energy losses. This process is repeated for deeper waters to depths of about 100-200 m. The result is a kind of deflection spiral, called an Ekman spiral (also referred to as Ekman veering) – named after Vagn Walfrid Ekman (Sweden, 1902). The actual depth of Ekman veering depends on wind strength. The net effect is a deflection of current flow about 90o to the wind direction – veering to the right in the northern hemisphere and to the left in the southern hemisphere.
![A diagrammatic representation of Ekman veering of water masses, and the development of an Ekman spiral (blue arrows). The depth limit of Ekman veering depends on wind strength and is indicated here by the horizontal dashed line. The lower part of the diagram is projected from the spiral – this projection was shown in the original 1905 paper by Vagn Ekman. Diagram is modified from ‘Offshore Engineering, Chapter 3 https://www.offshoreengineering.com/oceanography/ekman-current-upwelling-downwelling/ [Note 1: Ekman’s mathematical analysis of the effects of Earth’s rotation on ocean currents was based on observations by the famed Arctic explorer Fridtjof Nansen, who noted that icebergs along with his ice-fast ship (Fram) consistently deviated in their direction of movement by 20o to 40o to the right of the prevailing wind direction. Nansen also surmised that successive layers of water deviated further than the preceding layer, and that the deviations were a result of Earth’s rotation] Ekman, 1905. http://empslocal.ex.ac.uk/people/staff/gv219/classics.d/Ekman05.pdf](https://www.geological-digressions.com/wp-content/uploads/2023/05/Storm-surge-ekman-spiral-1024x721.jpg)
[Note 1: Ekman’s mathematical analysis of the effects of Earth’s rotation on ocean currents was based on observations by the famed Arctic explorer Fridtjof Nansen, who noted that icebergs along with his ice-fast ship (Fram) consistently deviated in their direction of movement by 20° to 40° to the right of the prevailing wind direction. Nansen also surmised that successive layers of water deviated further than the preceding layer, and that the deviations were a result of Earth’s rotation Ekman, 1905. ]
Geostrophic flows
The principles of geostrophic flow on a rotating Earth apply to air and ocean currents. The ambient direction of surface flow in ocean gyres is determined by Coriolis deflections of currents produced by the prevailing winds. As noted above, Coriolis affects also give rise to Ekman transport of currents that veer 90o from the wind direction – to the right in the northern hemisphere, and to the left in the southern hemisphere. Thus, as ocean currents rotate, Ekman veering tends to move surface water masses towards the centre of each gyre, and in so doing creates a central, ‘mounded’ sea surface. The potential rise in sea level near the centre of the gyres can be as high as one metre relative to the gyre margins.
However, there is a limit to the magnitude of sea level mounding because the gravity-induced, horizontal water pressure gradient also increases beneath the mounded water, resulting in outward flow of surface water parcels to regions of lower hydraulic pressure towards the gyre margins (i.e., the water basically flows downhill). Coriolis forces also act on this return flow deflecting it to the right in the northern hemisphere, in the same direction as the gyre rotation, and parallel to the sea-level surface contours. At this point, there is a balance between the horizontal water pressure gradient and Coriolis forces – flow under these conditions is called geostrophic flow.
Note 2: Sea level contours are analogous to groundwater equipotential contours – they represent lines of equal hydraulic potential (in other words, the potential energy available for flow). Flow occurs from high to low potential contours.
Note 3: There is a direct comparison with the movement of air masses where geostrophic air flow is parallel to air pressure contours, or isobars.
Thus, geostrophic flow is primarily a function of initial wind direction and Coriolis deflections that in turn give rise to Ekman transport. Geostrophic flow helps to maintain the continuity of ocean gyre rotation.

[Note 4: The Coriolis force is often called a fictitious force. It is a force that was invented to describe motion on a rotating sphere so that Newton’s Laws can be applied. The reasoning goes like this:
Newton’s Laws only work if our frame of reference is part of an inertial system. The First Law states that an object will not change its motion unless acted on by an external force – i.e., an object at rest will remain at rest, or an object travelling at constant speed will not accelerate or decelerate unless some force causes this motion to change. An inertial frame of reference is one where Newton’s First Law applies. And herein lies the problem if our frame of reference is a rotating body, such as Earth.
When we observe the course of the erupted ballistic from the volcano, the trace of its trajectory over the rotating Earth is curved. But this implies that, from our rotating Earth-bound frame of reference, the object is accelerating or decelerating (because the angle of trajectory changes). This means that our frame of reference is non-inertial and therefore Newton’s first law does not work.
If we were to observe the ballistic from some fixed point in space, say the nearest star Alpha Centauri (i.e., a fixed frame of reference rather than a rotating frame of reference), the trace of the trajectory would be a straight line and the velocity constant (keep in mind this is a hypothetical situation). In this case Newton’s first law would apply.
For obvious reasons it is an advantage to be able to apply Newton’s Laws from an Earth-bound frame of reference. To do this, Gaspard Coriolis invented a fictitious inertial force, the Coriolis force. This inertial force is required if our frame of reference is the non-inertial rotating Earth, but it is not required if our frame of reference is some distant fixed point in space.]
Sandstone lithofacies
Sedimentary lithofacies – An introduction
Ripple lithofacies: Ubiquitous bedforms
Ripple lithofacies influenced by tides
Tabular and trough crossbed lithofacies
Laminated sandstone lithofacies
Low-angle crossbedded sandstone
Hummocky and swaley cross-stratification
Lithofacies beyond supercritical antidunes
Subaqueous dunes influenced by tides
The three pycnals: Hypo-, homo-, and hyper
Storms and storm surges: Forces at play
Gravel lithofacies
Introducing coarse-grained lithofacies
Crossbedded gravel lithofacies
