Plotting the orientation of a plane on a stereonet; finding strike and dip from two apparent dips
This post is part of the How To… series
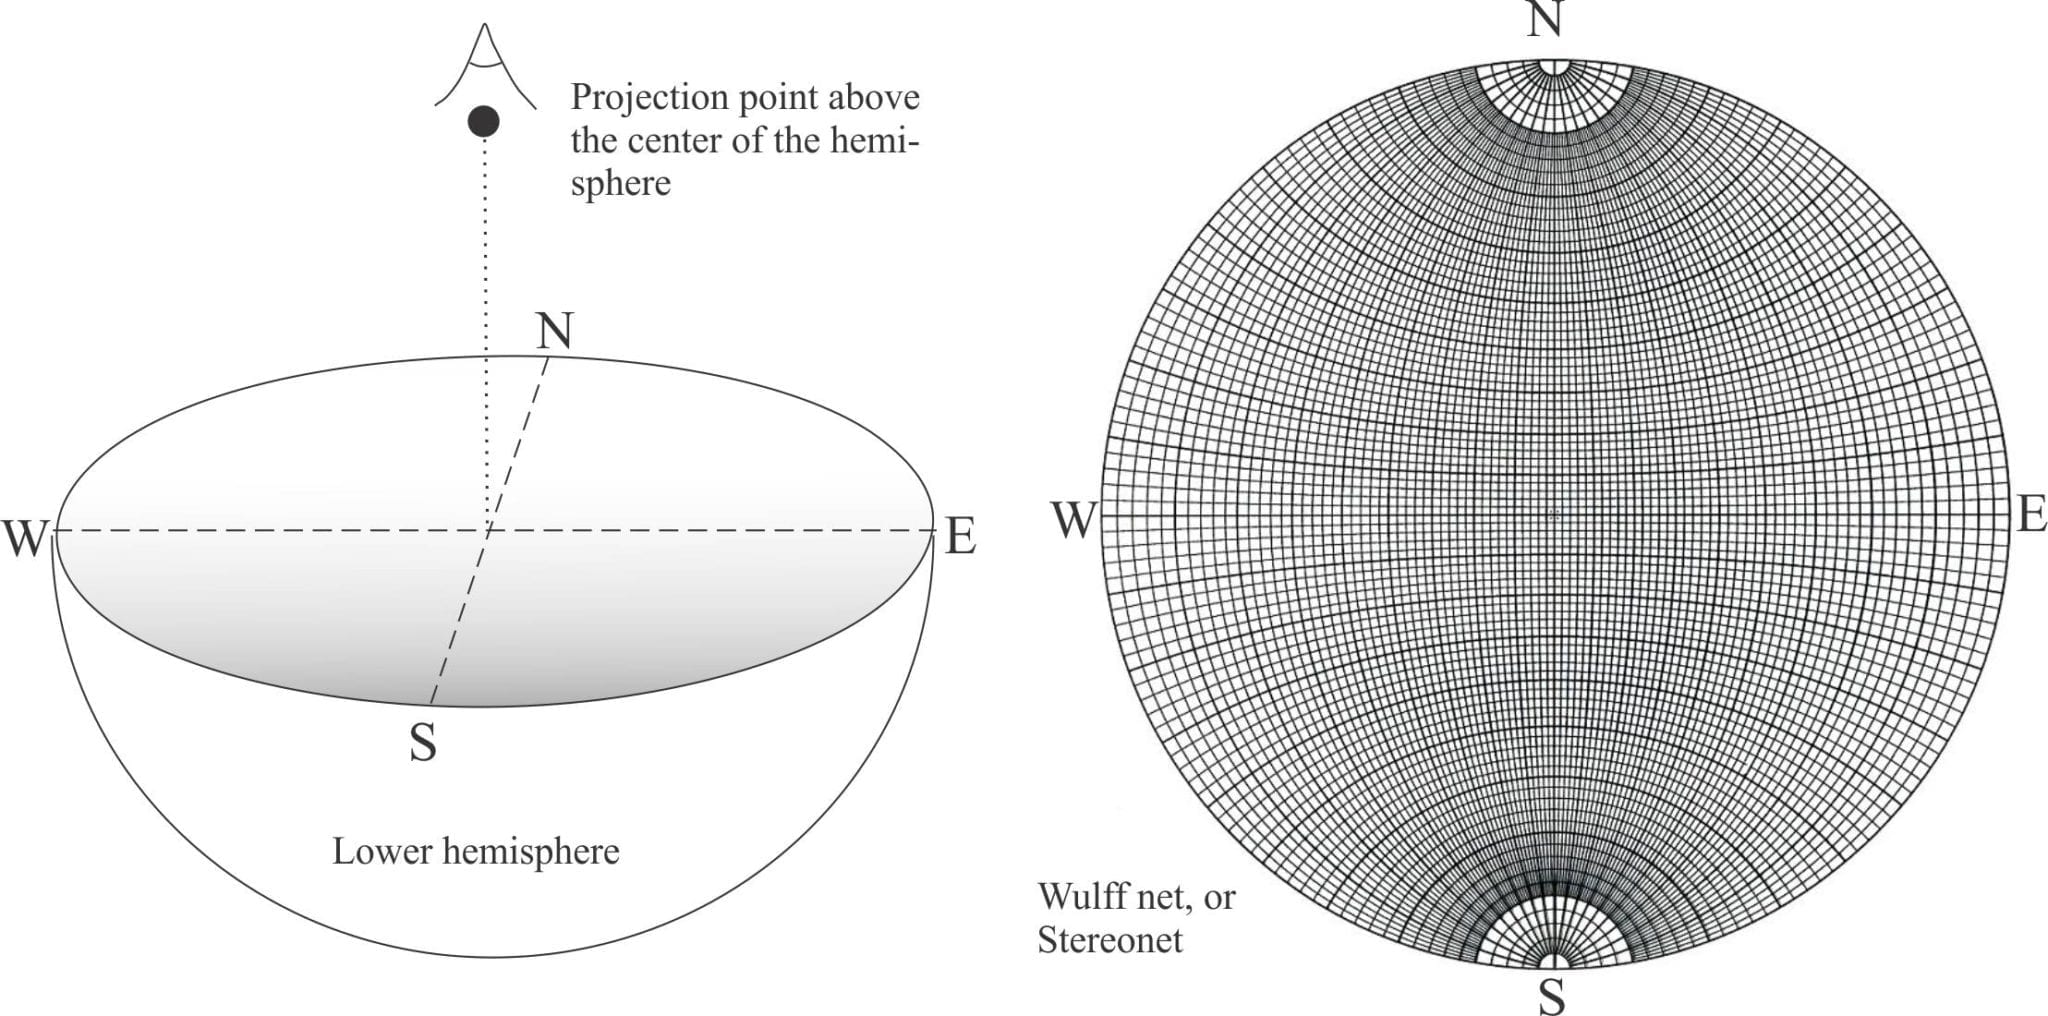
My first exposure to stereographic projection methods of structural analysis was one of my more baffling moments of undergraduate geological learning. Looking around the class I could see I wasn’t the only one. Our tutor, a master at pointing out the obvious, suggested we try thinking in three dimensions. In retrospect it was probably some of the best advice I ever received. After all, geology is nothing if not an exercise in visualizing the 3- and 4-dimensional world around us.
Visualize a sphere; cut the top half off – we don’t need it. If you look directly down the vertical axis of the hemisphere it will appear to be two-dimensional. When you do this, you are basically projecting the 3-D hemisphere onto a 2-D circle. Once this projection has become embedded in your mind’s eye, everything else will fall into place.
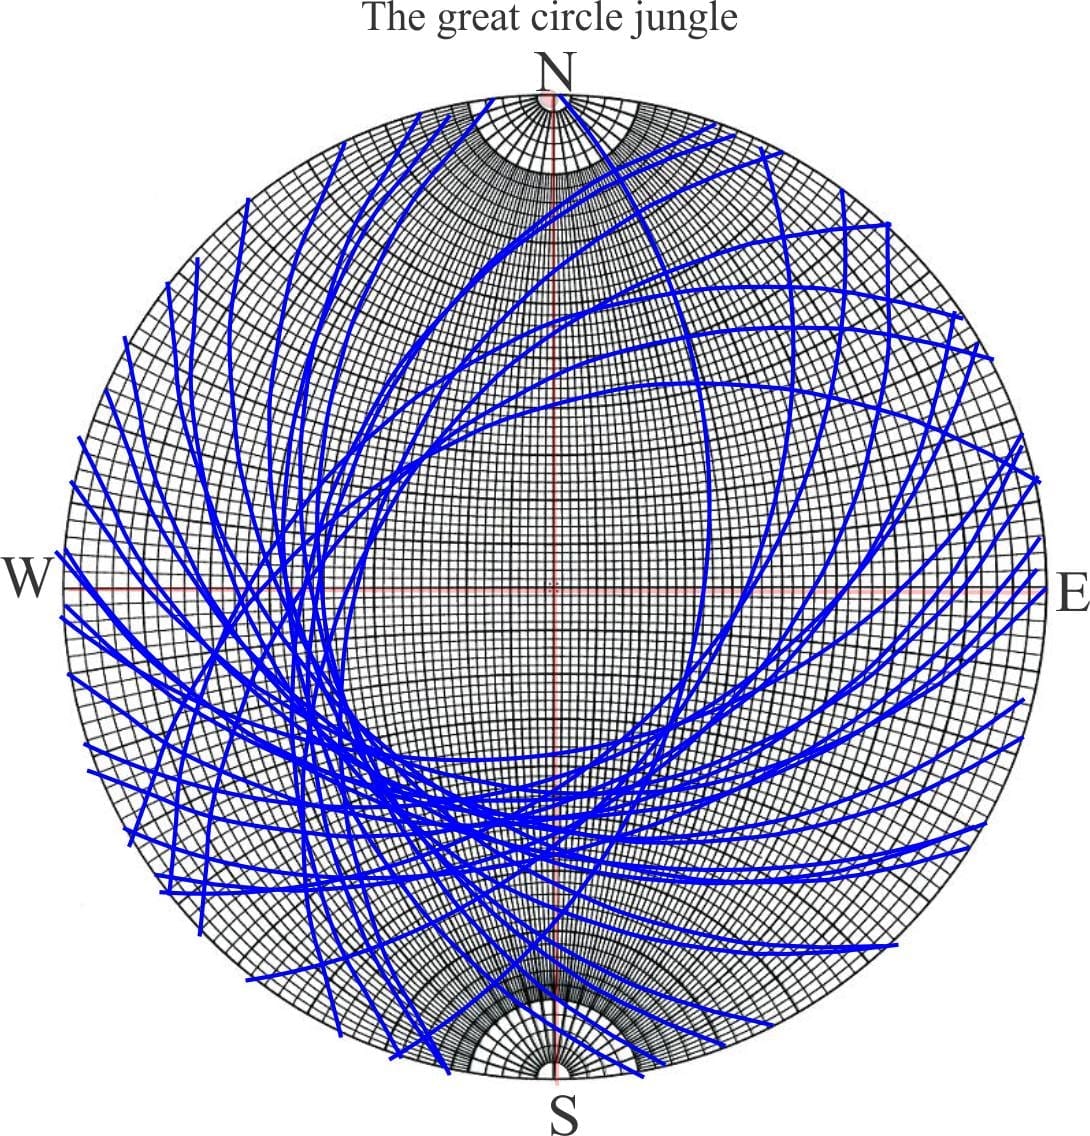
The brief animation below shows a hemisphere rotated from an initial oblique view to the point where you are looking directly down the axis (or radius). At this point the hemisphere is projected as a circle that can then be overlaid by a stereonet grid like the example shown above. Each point and curve on the grid represents a point and curve on the hemisphere.
Stereographic projection is all about representing planes (e.g. bedding, foliation, faults, crystal faces) and lines (e.g. dip and plunge directions, fold axes, lineations) onto the 2-D circle. In geology, we overlay the 2-D projection with a grid of meridians, or great circles (analogous to longitudes), and parallels or small circles (analogous to latitudes). Thus, all compass points are represented. The net-like grid is called a Wulff Net, or stereonet. It is an equal angle grid where meridians and parallels intersect at right angles.
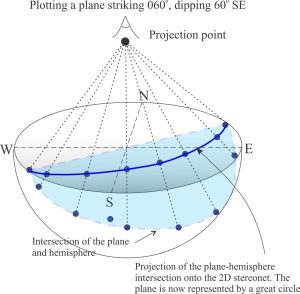
Note the two extreme projection conditions: the circumference is actually the great circle of a horizontal plane; the opposite is a straight line passing through the centre that is the projection of a vertically dipping plane. Thus, shallowing dips tend toward the circumference.
The following animation shows how the great circle changes as the plane rotates from vertical to horizontal dip (in increments of 15°). The great circle corresponding to the dip is in red. The line drawn from the two points on the circumference through the centre is the strike.
In practice we use a transparent overlay pinned to the centre of the stereonet; we rotate the overlay according to the orientation of lines and planes.
Plotting a dipping plane
Follow the next exercise with the short animation. It was made from still images: use the pause and play buttons as you work through the exercise.
Imagine a plane striking 060o (N60E), dipping 60o SE; the plane passes through the centre of the sphere. In our vertical 2-D view the intersection of the plane with the hemisphere appears as a curved line, or great circle. Rotate the overlay counter-clockwise 60o; mark this point on the circumference. The great circle representing the angle of dip is found by counting along a line at right angles to the strike, i.e. along the E-W axis, counting 60o from the horizontal (the circumference).
Note that in the 2-D view, the great circle meets the circumference at 060o and 240o that are two points on a horizontal line across the plane; the great circle is therefore the strike of the plane.
If a plane projects onto the stereonet as a great circle, then a line or lineation on the plane will plot as a point on the same great circle. To illustrate, we will find the true dip and strike of a plane for which we have measured two apparent dips: (1) 30o at 315o (N45W) and (2) 32o at 014o (N14E). On a transparent overlay, mark the positions of the N-S and E-W axes, and the stereonet centre. For (1), rotate the overlay 45o clockwise, mark the position at the N pole, then count 30o from N along the N-S axis. This point is the projection of apparent dip (1). Likewise, repeat for apparent dip (2). Rotate the overlay until the two apparent dip projections lie on the same great circle – read the bearing from N and the true dip along the E-W axis.
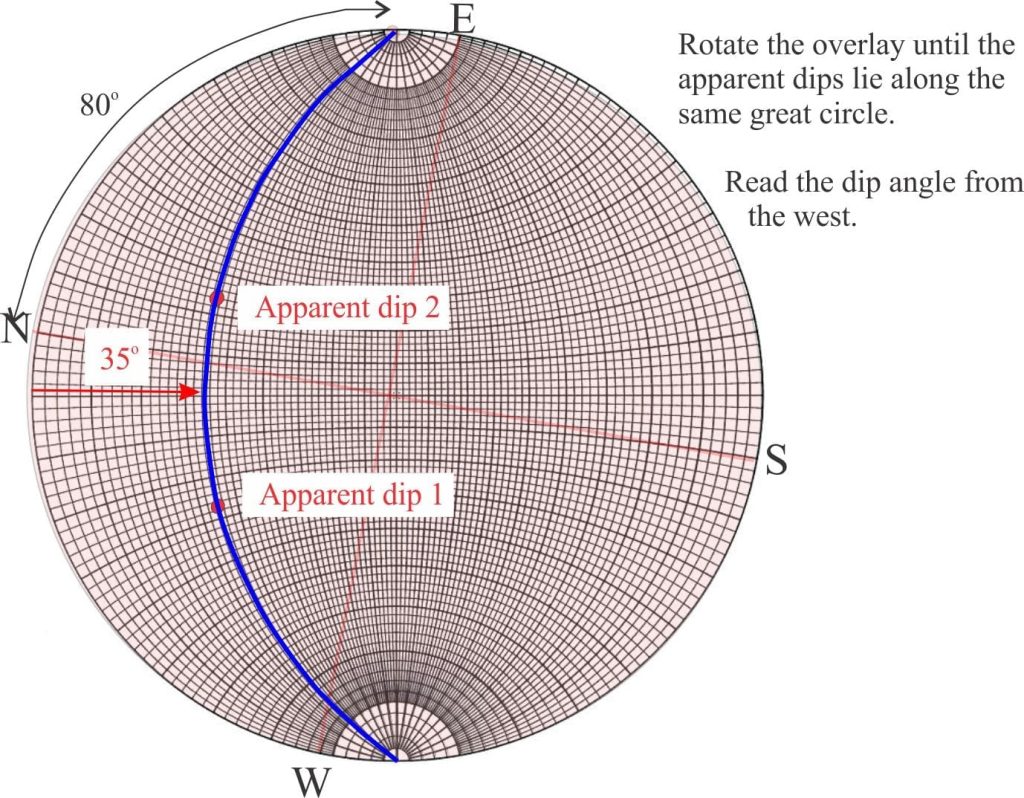
Follow this exercise with the short animation. It was made from still images: use the pause and play buttons as you work through the exercise.
Stereographic projection is a powerful method, not just to solve relatively simple (but important) problems of dip and strike, but as an analytical tool for more complex structural geology. There are several good software programs and Apps to automate projections for large data sets. But before you dive into these digital tools, try the simple overlay first – there’s nothing like a hands-on approach to help galvanise an understanding of basic methodology.
Some other useful posts in this series:
Solving the three-point problem
Stereographic projection – unfolding folds
Stereographic projection – poles to planes
The Rule of Vs in geological mapping
Here are some good website links:
Rick Allmendinger’s Stereo 10 – there’s also a mobile App version
Innstereo (open source)
Links to several programs in The Structural Geology Page
