This post is part of the How to… series
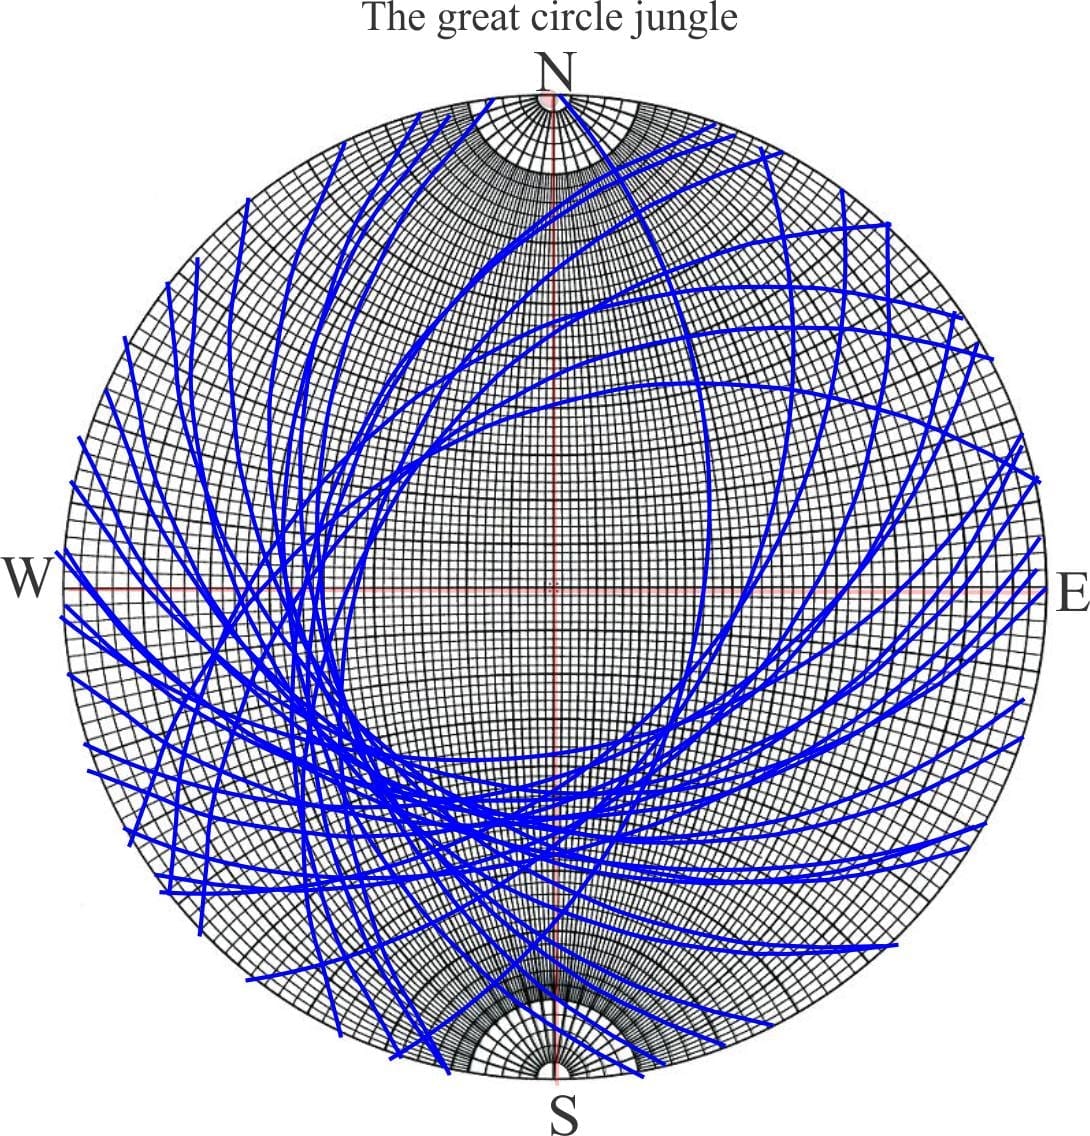
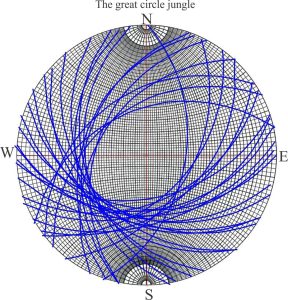
Stereographic projection is used in geology to decipher the complexities of deformed rock by looking at the relationships between planes and linear structures; their bearings (trends) and angular relationships one with the other. The data is plotted on a stereonet as great circles and points (Wulff and Schmidt nets). A stereonet can become pretty messy where there is a lot of data – a seemingly impenetrable maze of great circles. This is where poles-to-planes come into their own.
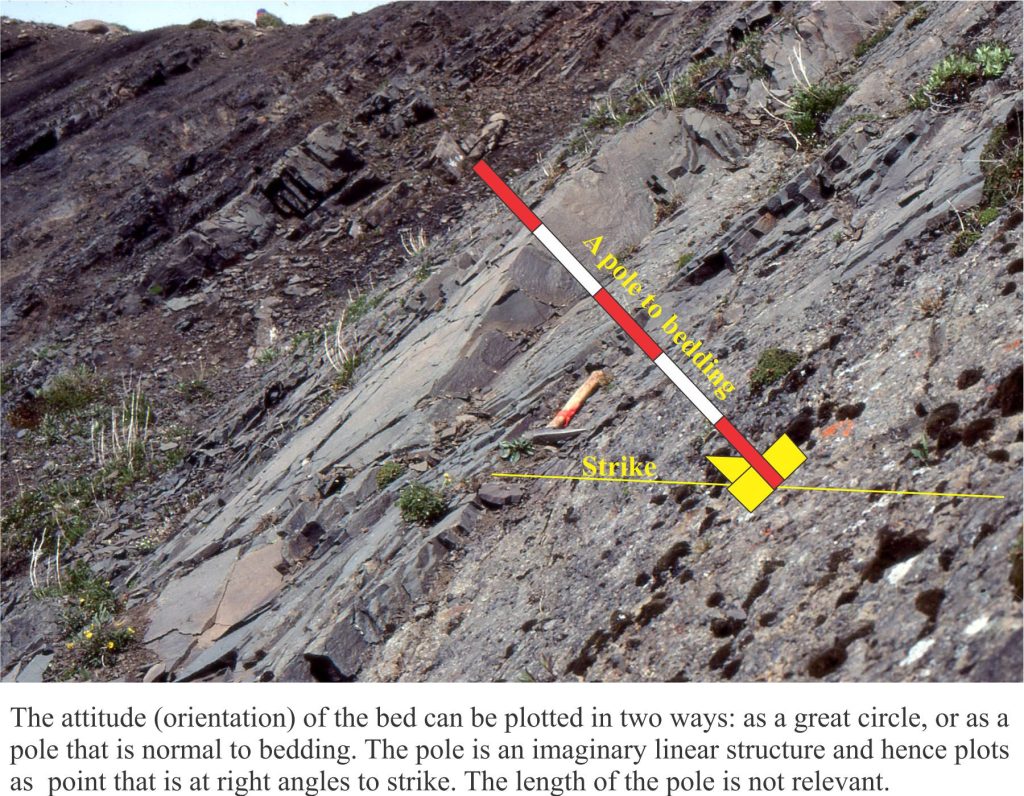
Instead of plotting the great circle to a planar structure like bedding, we plot its pole. Imagine this as a pole oriented at right angles to the plane. Because the pole is a linear feature, it plots as a point on our stereonet. As long as the pole is 90o to strike, it will contain all of the information in the associated great circle. We refer to this point as the pole to bedding (or any other planar feature). Poles to horizontal planes will plot at the centre of the stereonet; poles to vertically dipping planes at the perimeter. Poles to planes dipping at any other angle will plot within these bounds.
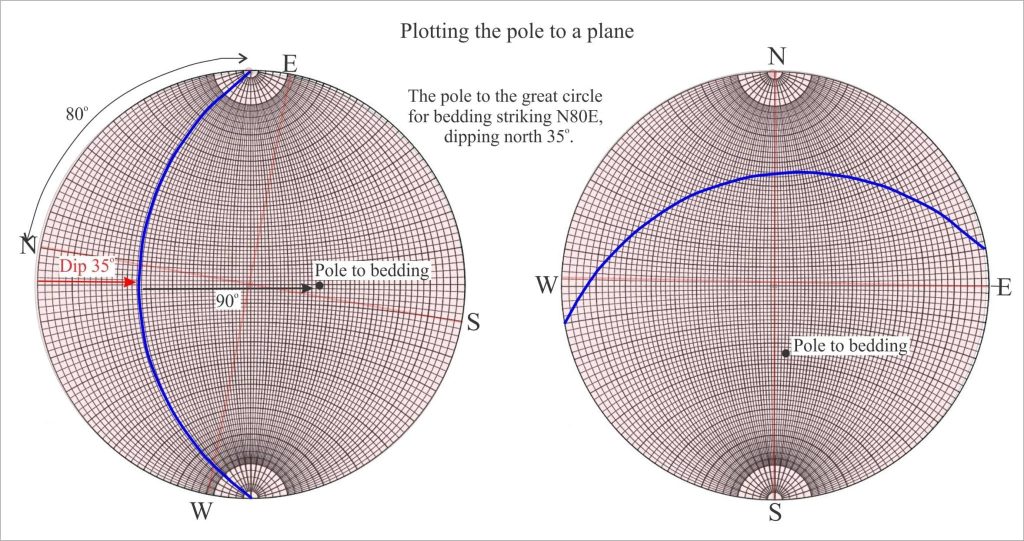
In the example below the orientation of a bedding plane is plotted on an overlay as a great circle. With the great circle pinned to N, count 90 along the W-E axis passing through the centre of the stereonet; this point is the pole.
For cylindrical folds the poles to bedding on each limb will all plot on the same great circle (or close to it). The pole to this great circle corresponds to the β point – the fold axis, from which we can read its trend and plunge. Stereographic plots that use poles to bedding or other planes are called pi (π) plots. The utility of pi plots is illustrated in the example of an overturned anticline (the diagrams have been modified from D.M. Ragan, Structural Geology: An introduction of graphical techniques 1968, Figure 11.3).
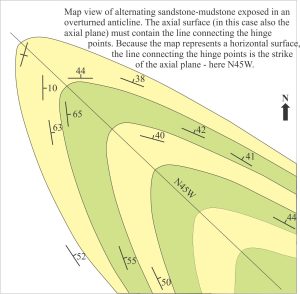
Dip and strike data on each fold limb are plotted as poles to bedding. We can also locate on the geological map the hinge points for each layer. The line connecting hinge points must lie on the axial surface. However, because our map view is horizontal, this line corresponds to the strike of the axial surface – another important piece of information. What we do not know about this structure is the orientation of the fold axis and the dip of the axial plane. The sequence of diagrams that follows shows the main tasks involved in solving this problem.
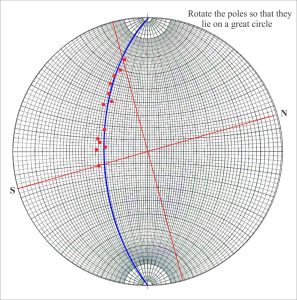
- Find the great circle describing the poles to bedding by rotating a transparent overlay (make sure you mark the original N-S positions on the overlay).
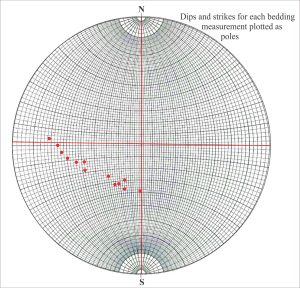
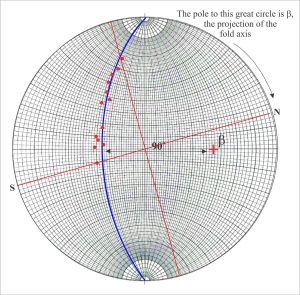
- With the great circle pinned to North, count 90o from the circle along the east-west axis (the count must pass through the centre of the stereonet); this point is β, the fold axis.
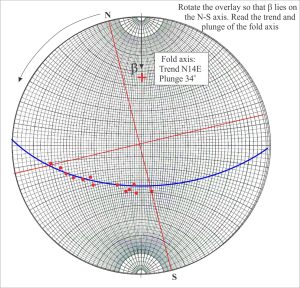
- Rotate the overlay counter-clockwise until β lies on the N-S axis. From North, read the fold axis trend and plunge.
- Plot the line representing the strike of the axial surface (N45W). The great circle containing this line must also pass through β.
- With the second great circle pinned to North, read the dip of the axial surface.
- Rotate the completed stereonet back to its original position.
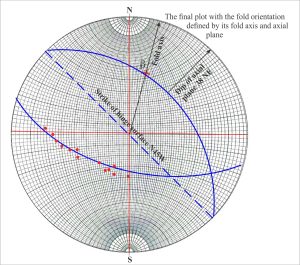
You now have all the information you need to describe the orientation of the anticline.
Some other posts in this series:
Stereographic projection – the basics
