Read any scientific paper or blog on climate and you’re bound to come across the phrase radiative forcing. Radiative forcing is central to all climate science. Radiation from the sun heats our atmosphere and earth surface. Some of this radiation is reflected back to space. If there is a balance between incoming and outgoing radiation then average global atmospheric temperatures neither increase or decrease. However, if the balance is perturbed, climate will warm or cool. Radiative forcing causes climate imbalances. Thus, volcanic aerosols tend to cool things off, decreasing albedo will tend to warm them.
One of the functions of climate models is to predict the effects of radiative forcing at different levels through the atmosphere. This applies to any climate model, whether it attempts to predict the effects of volcanic aerosols in the stratosphere, or the possible outcomes of El Nino cycles. Models in this sense are used as predictive tools; they help us extend our thinking about possible outcomes of certain actions, or processes, such as radiative forcing.
However, model predictions are only predictions until there is some degree of real world testing, or in the language of science, empirical verification. There is a somewhat jaundiced view, particularly as it relates to climate modeling, that in the absence of good empirical or experimental data, a model is useless or that people cannot have confidence in its predictions. This view misconstrues the purpose of models; as vehicles to formulate ideas, and stir investigative science. Model predictions are not facts, but ignore them at a cost. Show me the wisdom of waiting for empirical verification of a groundwater contaminant plume predicted to reach your water supply in two years.
Any discussion on climate and radiative forcing inevitably turns to greenhouse gases and the role of CO2. Increasing atmospheric concentrations of CO2 are demonstrable. However, the radiative forcing of CO2, as the main culprit for increasing surface temperatures, is based on models that incorporate laboratory data, the physics of greenhouse gases, and thermodynamic considerations; direct measurement of the radiative heat transfer by CO2 and its contribution to atmospheric warming, has been elusive. A paper published in Nature by D. Feldman and colleagues provides the first direct evidence of surface heating by CO2. The analysis covers the period from 2000 to 2010, for which the measured increase in atmospheric CO2 concentration was 22 ppm.
The experiment outlined in this report is based on the spectroscopic properties of atmospheric gases. Spectroscopy is the measure of the interaction between atoms or molecules, and radiation (such as visible or UV light). The interaction involves a transfer of energy, for example as heating or cooling; the amount of heat transfer (commonly expressed as watts per square meter) can be calculated using established, and well tested equations. For the Feldman et al. experiment, spectral data was obtained from two laboratories: the Southern Great Plains, and the Alaska North Slope, and includes data for CO2, methane, ozone, and water vapour. The contribution of heat transfer by CO2 alone was teased from the data by subtracting the contributions from these other components. Heat transfer time series for the 2000-2010 period show statistically valid trends for both experiment locations, of 0.2 watts/square metre per decade, with errors of 0.06-0.07 watts/square metre. The seasonal range is 0.1-0.2 watts/square metre, because of mediation by photosynthesis. This is the actual value for heat energy transfer to the northern hemisphere surface from increasing CO2, confirming the value predicted by radiative forcing models.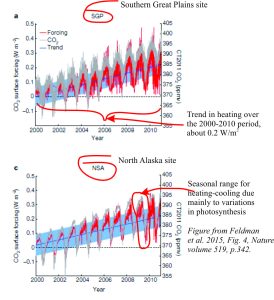
The published results are important because, for the first time, scientists have demonstrated the causal link between increasing atmospheric CO2 and increasing heat transfer to the surface. Average surface temperatures for the same 2000-2010 period increased about 0.1°C. These numbers seem quite small in the grand scheme of things. But even small changes in the global averages can significantly affect regional climates. We learn this lesson every time a volcanic eruption plume sends aerosol particles into the upper atmosphere. The average cooling from the 1991 Pinatubo eruption was barely 0.5°C and yet this small change in temperature was enough to present Europe with 3 or 4 very chilly winters. That numbers like this are small, whether they are values of changing heat, or the seemingly miniscule 0.04% atmospheric CO2, is largely irrelevant. More important is an understanding of cause and effect, and the response that such changes bring about.

