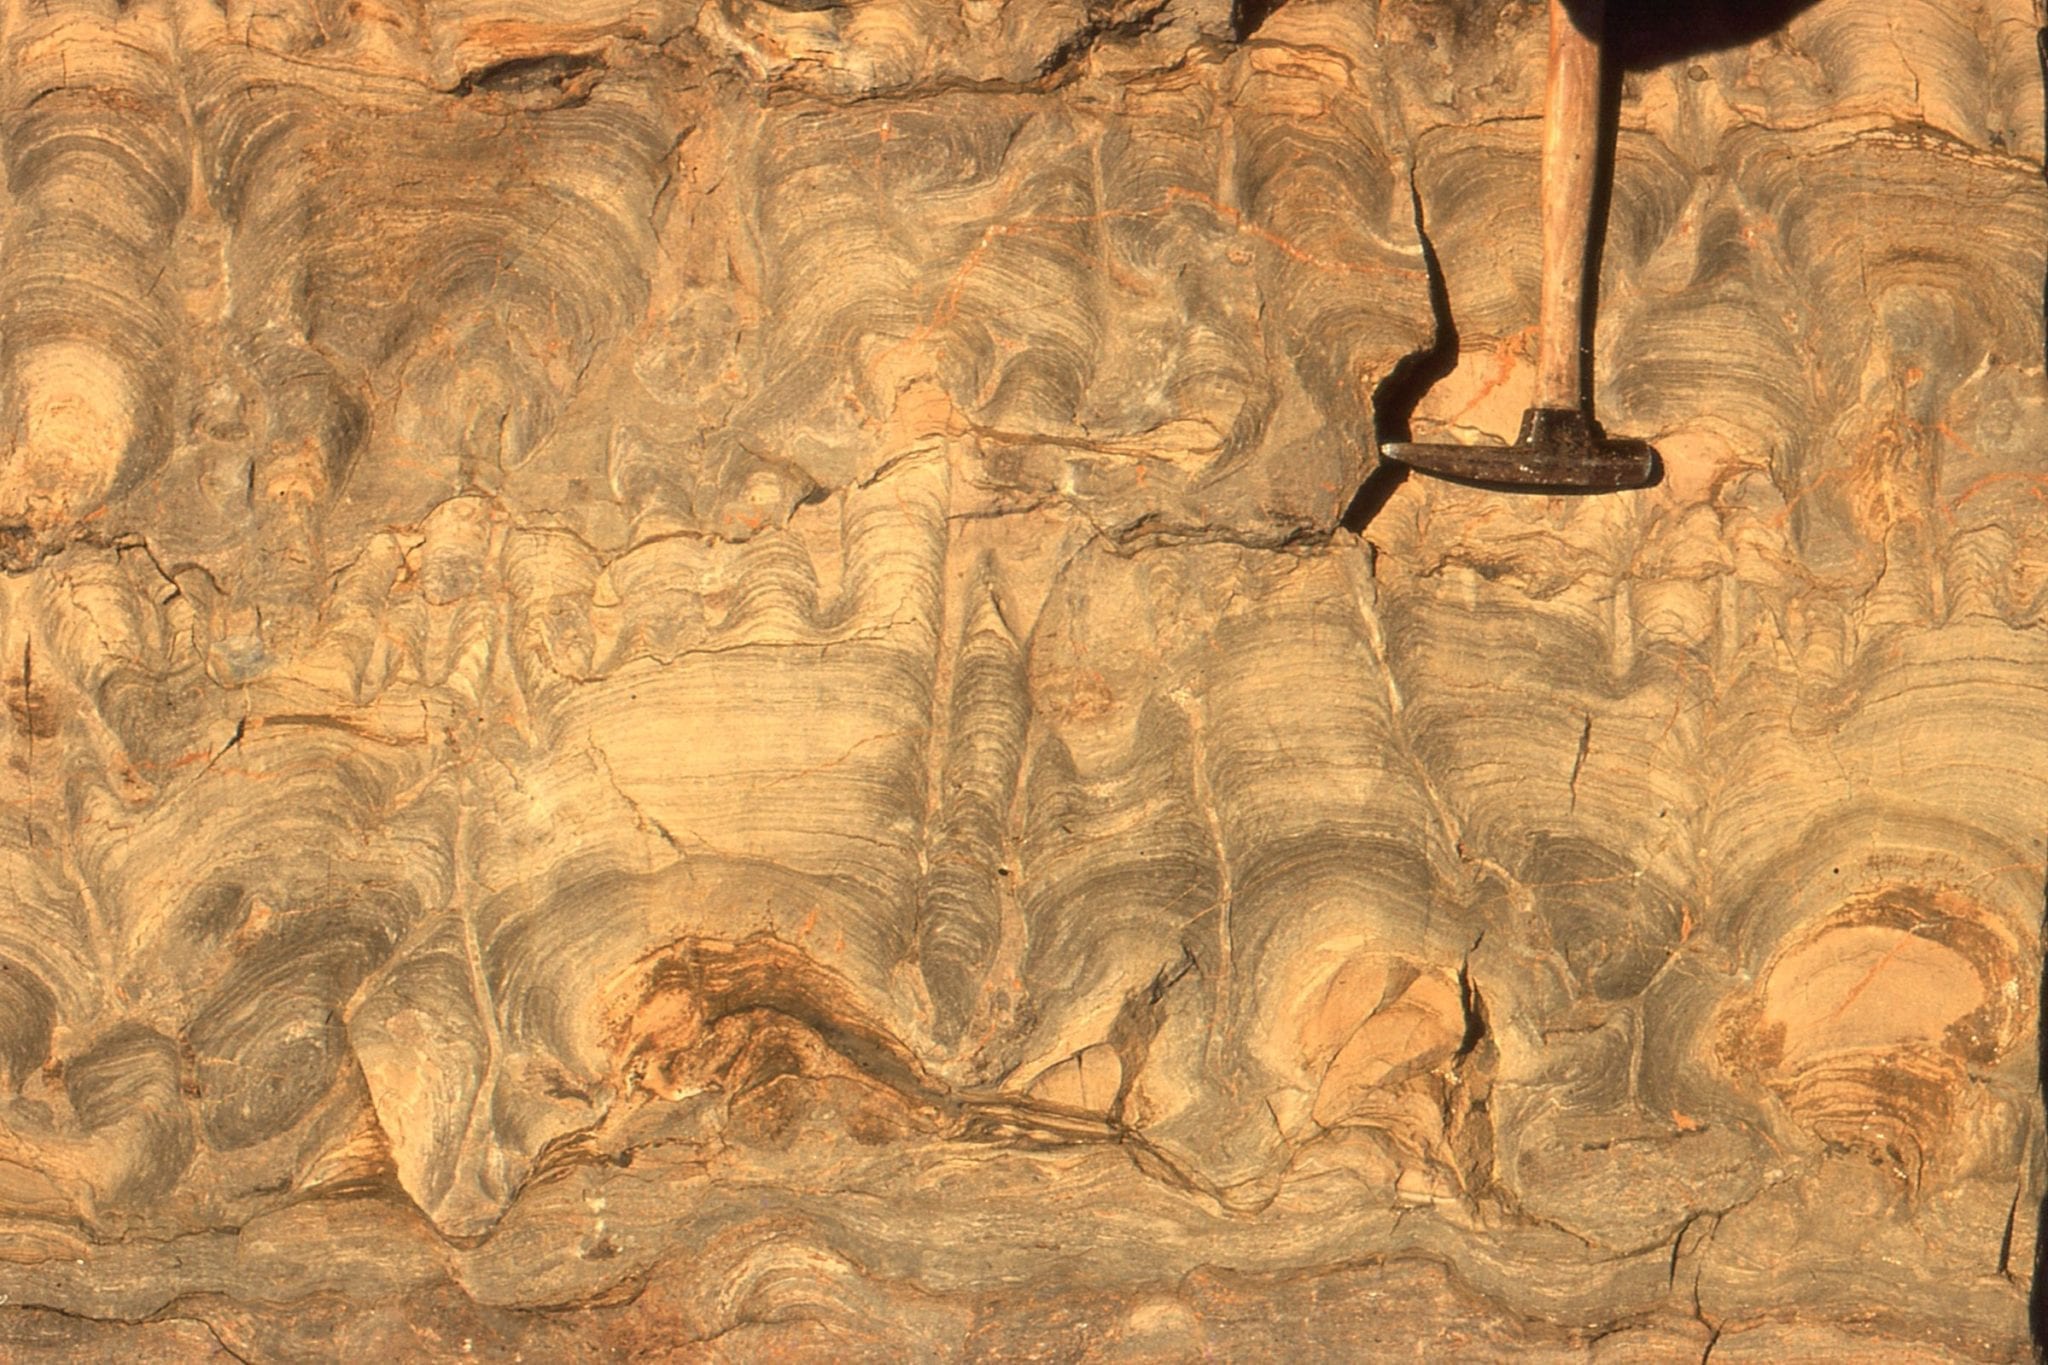
A brief look at identifying shoreline trajectories in stratigraphic successions.
This post is part of the How To…series on Stratigraphy and Sequence Stratigraphy
Shoreline excursions are the inevitable response to fluctuations in relative sea level (regressions and transgressions) and/or changes in sediment supply. We have known this for some time; shoreline migration is the logical outcome of Walter’s Law of facies translation, Grabau’s insights, and later analysis of shoreline translations by, for example, Curray (1964) and Douglas Cant (1991). Guided by stratigraphy and facies analysis, we can plot these shoreline trajectories across a 2-dimensional profile that parallels depositional dip (Helland-Hansen and Martinsen, 1996). The logic behind plotting shoreline transits can also be applied to shelf-edge clinoform trajectory, where the transit of clinoform rollover (the relatively abrupt change in slope) is tracked (Helland-Hansen and Hampson, 2009*1). This post focuses on shoreline trajectories.
If we want to determine the shoreline trajectory for a succession, we need to know what a shoreline is and how to identify it in the stratigraphic record.
Criteria for recognizing ancient shorelines
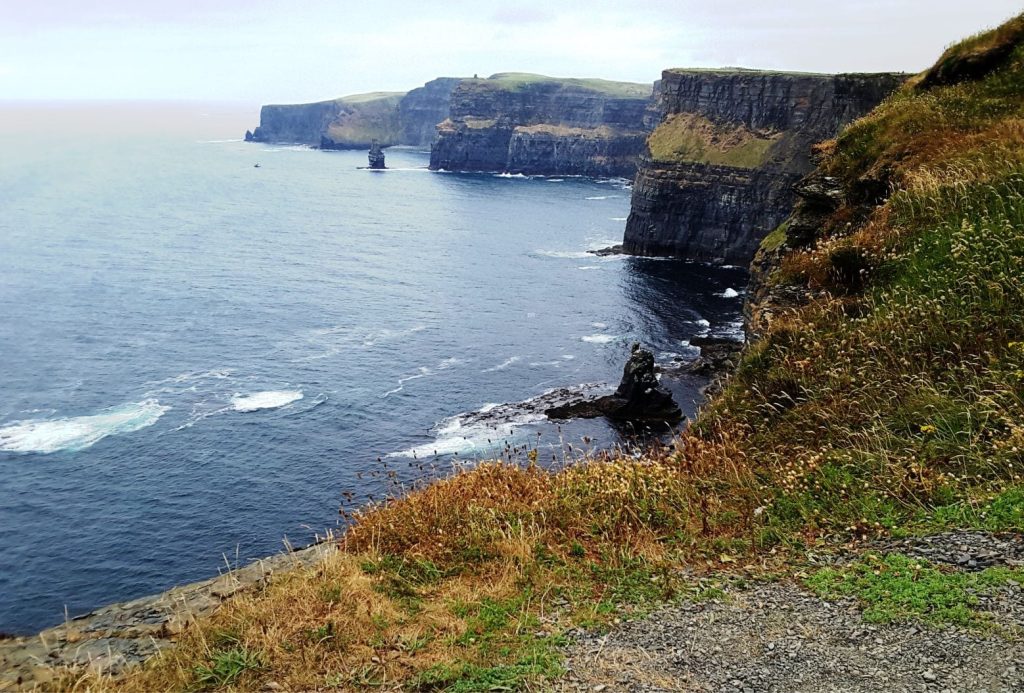
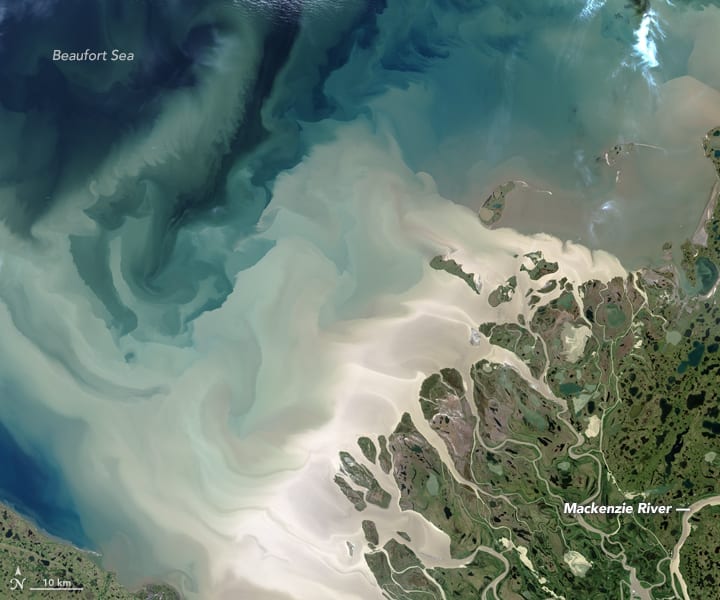
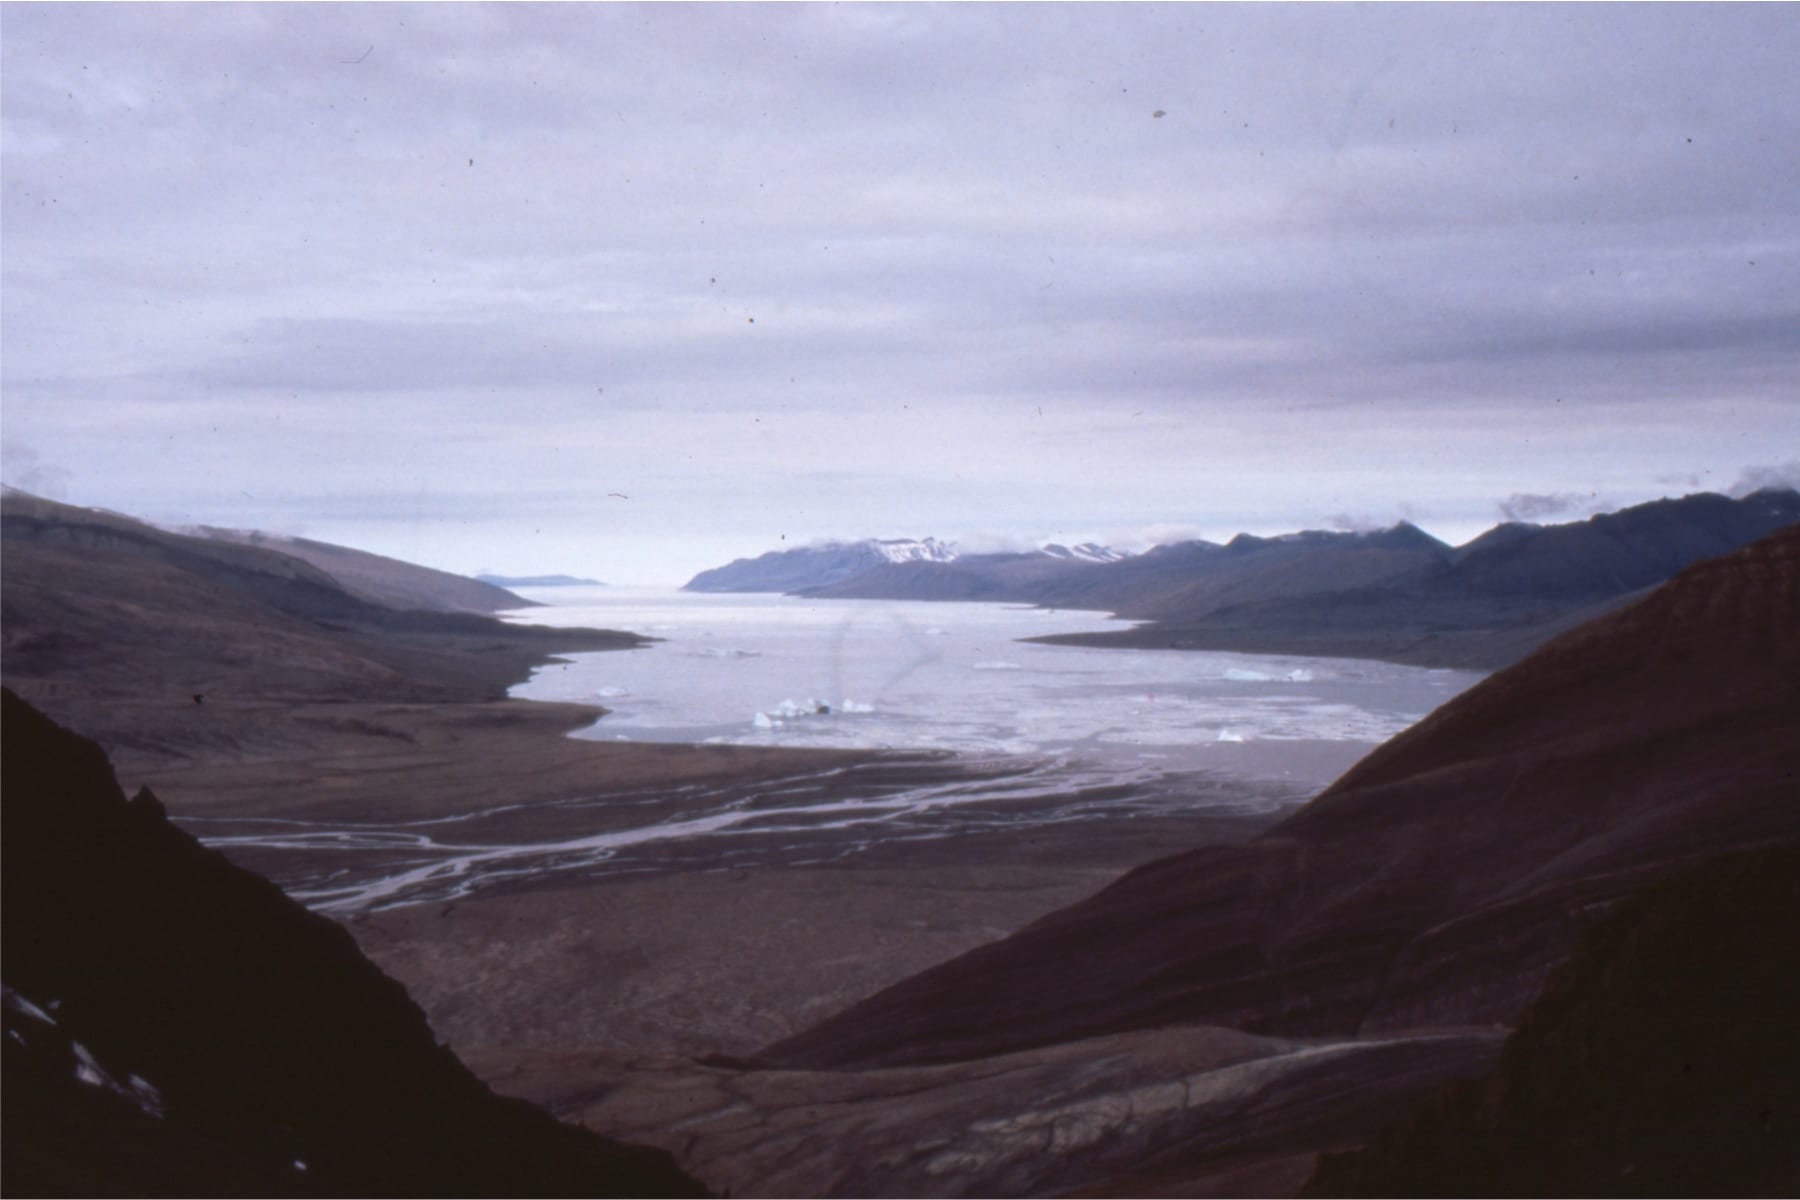
A shoreline is one of the most fundamental boundaries of our physical world; the divide between marine or freshwater bodies, and everything landward of this line. Notwithstanding this iconic status, the definition of a shoreline is a bit arbitrary, particularly in marine settings. Do we place the line at the low or high tide mark, at the spring-tide limit, or some average position in between.? The nature of a shoreline also depends on coastal geomorphology, for example, compare a broad sandy beach on a high wave-energy open ocean coast to that fronting muddy tidal flats in low energy harbours and lagoons, or a cliffed coast (with no actual beach) to a bouldery pocket beach.
The precariousness of the rock record means that geologists can conveniently put the niceties of strict definitions aside – it is rarely possible, in ancient marine or lacustrine successions, to be able to point to a high tide or any other “line” because of the vagaries of deposition, erosion, and preservation associated with the shallowest of marine or lake deposits. Shoreface ravinement during transgression is important in this regard, because it can remove some or all deposits associated with former shorelines.
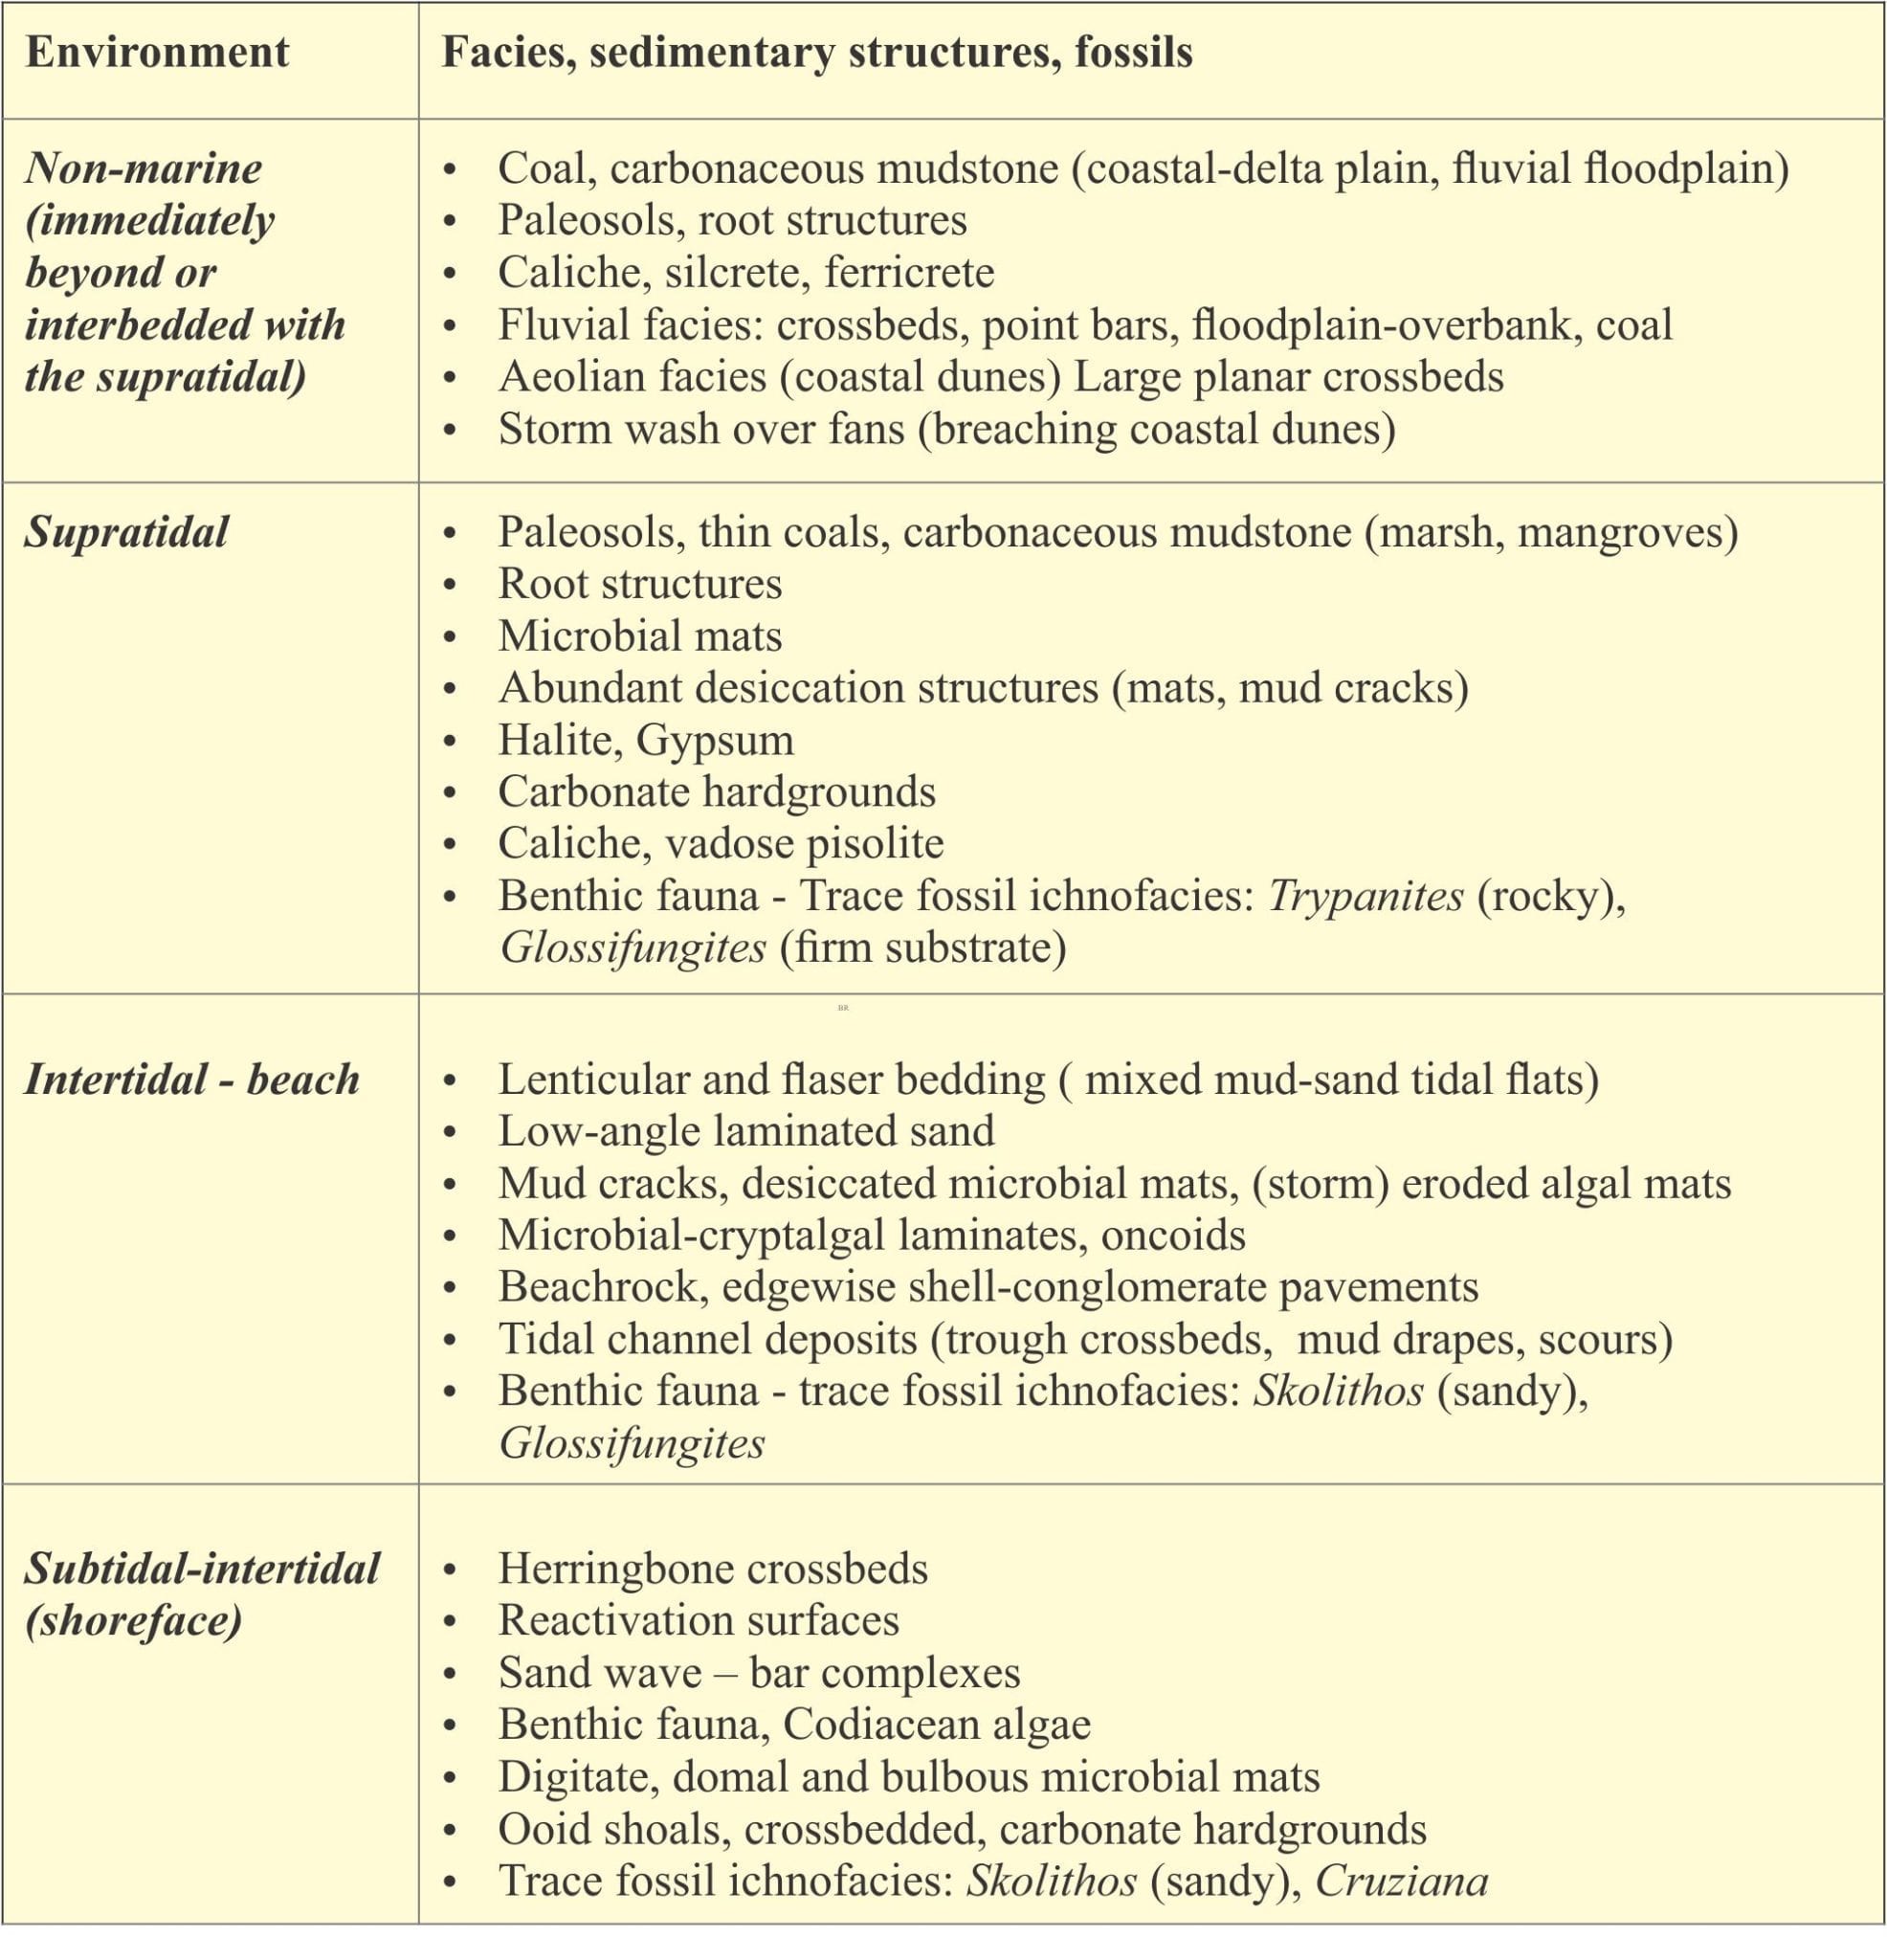
In general, we need to take a broad view of the facies presented to us in a stratigraphic section. It’s a bit like viewing the coast from a distance – the further away we are, the more line-like it appears to be. Rather than looking for fossil shorelines, we look instead for associations of facies and stratigraphic trends that indicate proximity. For example, sedimentary composition, structures and fossils may indicate that a stratigraphic succession shallows-upward; with a bit of luck it will include facies we infer to be intertidal or supratidal, which approximates a paleoshoreline in a stratigraphic context. If the succession contains paleosols and thin coals, then we can infer that the paleoshoreline lies somewhere beneath these facies and the uppermost marine deposits.
The important point to note here is that we identify paleoshorelines using stratigraphic trends and sedimentary facies. Stratigraphic trends are those we observe in cycles, and in this context parasequences play a key role. Therefore, plotting shoreline trajectories relies on our ability to track the inferred position of shorelines through a succession of parasequences.
Here are some criteria that indicate proximity to paleoshorelines.
Shoreline trajectories
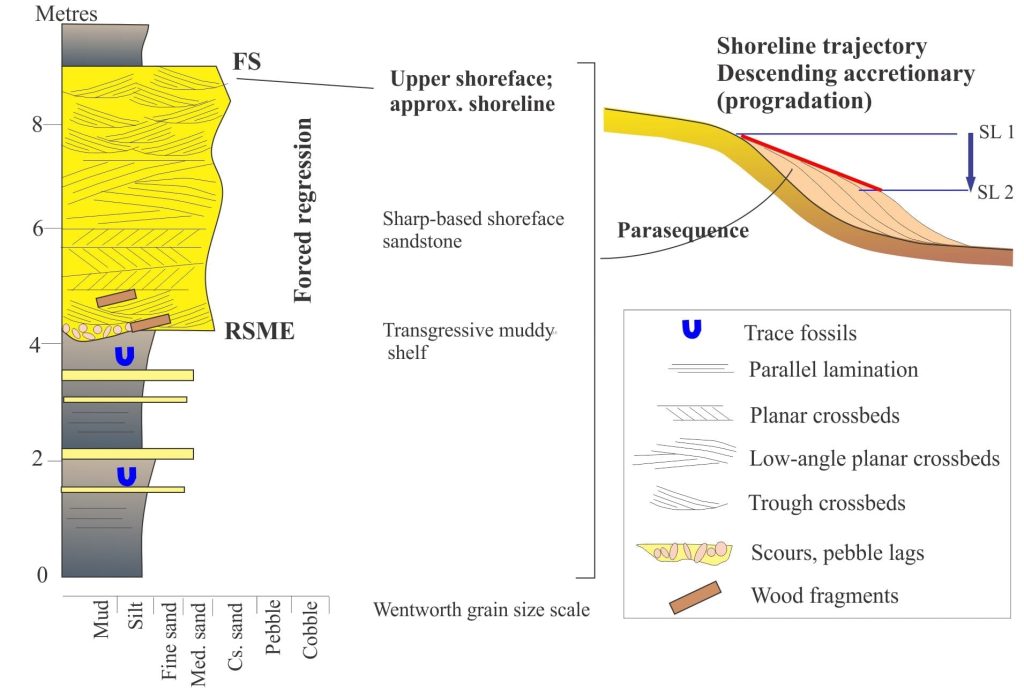
This part of the discussion draws on two important publications by Helland-Hansen and Martinsen (1996) and Helland-Hansen and Hampson (2009 *2). Trajectories are plotted according to the stacking patterns of successions that contain evidence for proximity to paleoshorelines; commonly these successions correspond to parasequences. For example, stacking of parasequences across a prograding shelf would plot as a horizontal trajectory, as each successive shoreline moves seaward. In contrast, the locus of successive shorelines in an aggrading stack of parasequences would plot as a (approximately) vertical line. A combination of progradation and aggradation (a common situation) results in an inclined shoreline trajectory.
Shoreline trajectories are divided into classes based on changes in relative sea level (regression, transgression). These sea level categories are subdivided further according to sediment supply that is superimposed on sea level fluctuations, and to this end two conditions are recognized, illustrated in the three diagrams below:
- Accretionary, where sediment supply is high such that deposition influences the position of the shoreline, for example during progradation, and
- Non-accretionary, where sedimentation is low or nil, or bypasses the shelf, and hence does not directly influence the position of the shoreline.
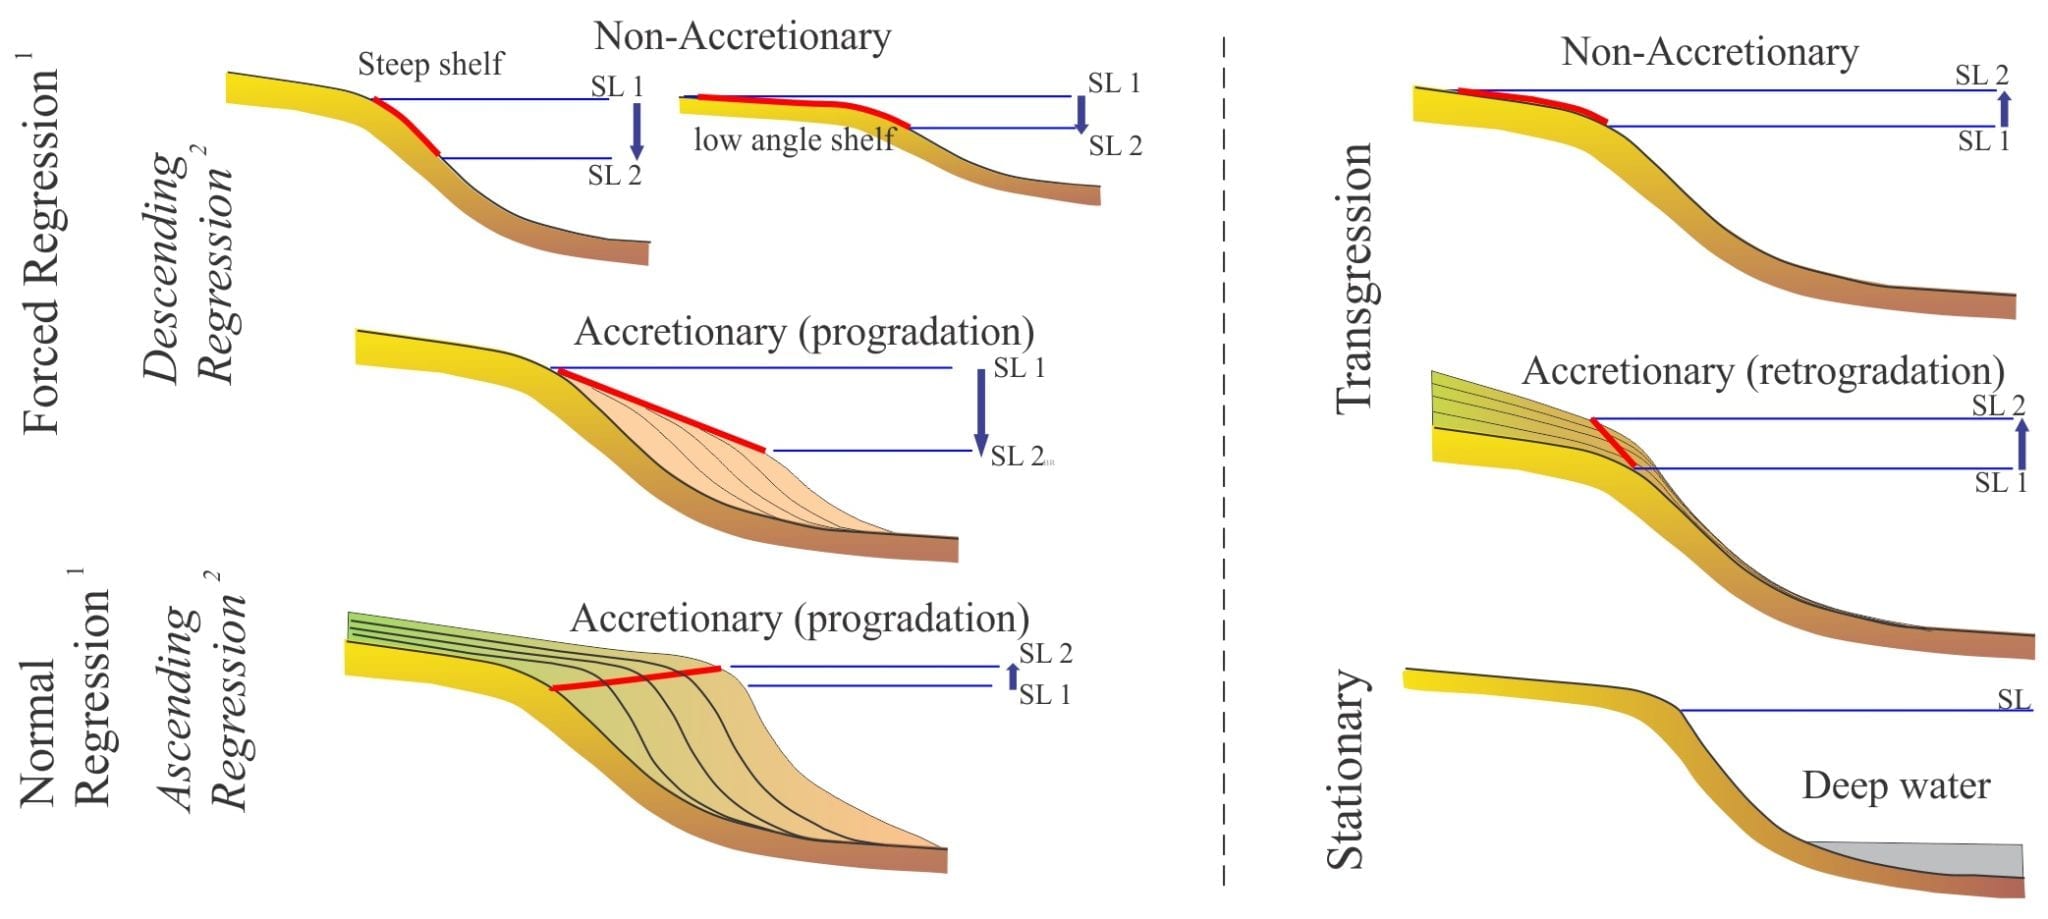
In their 1996 paper, Helland-Hansen and Martinsen show the relationship between trajectory classes and regressive conditions that, in sequence stratigraphic schemas are referred to as normal or forced regression. The later paper (2009) has removed direct reference to these sequence stratigraphic terms. One reason for doing this was to emphasize the idea that shoreline trajectories can be described more objectively. So, instead of forced regressive shoreline transits (1996) there are descending accretionary regressive transits (2009); normal regressive trajectories are replaced with ascending accretionary regressive trajectories.
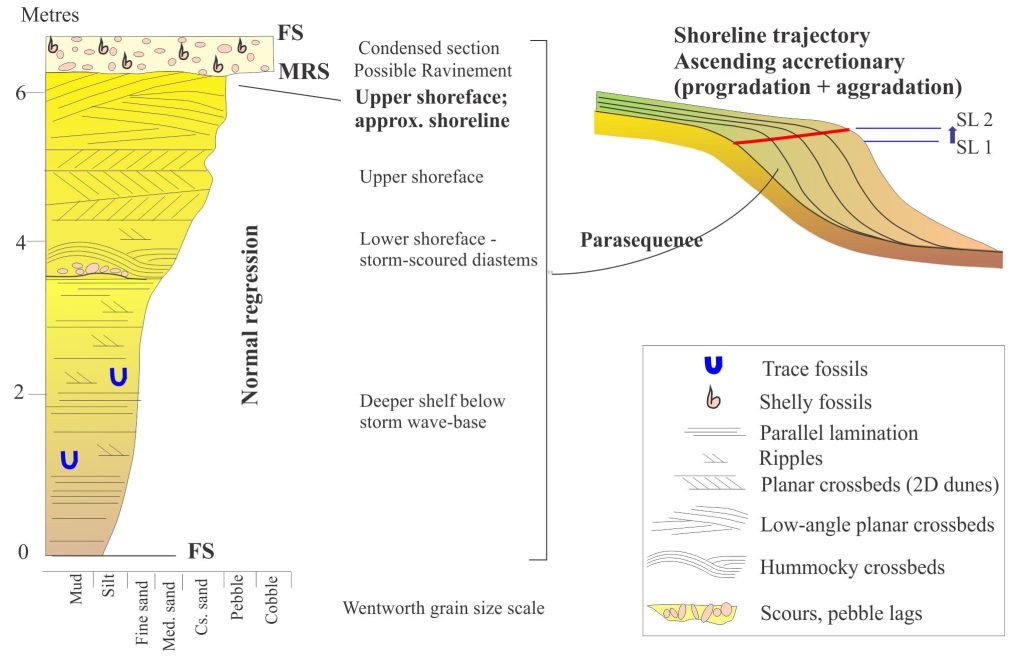
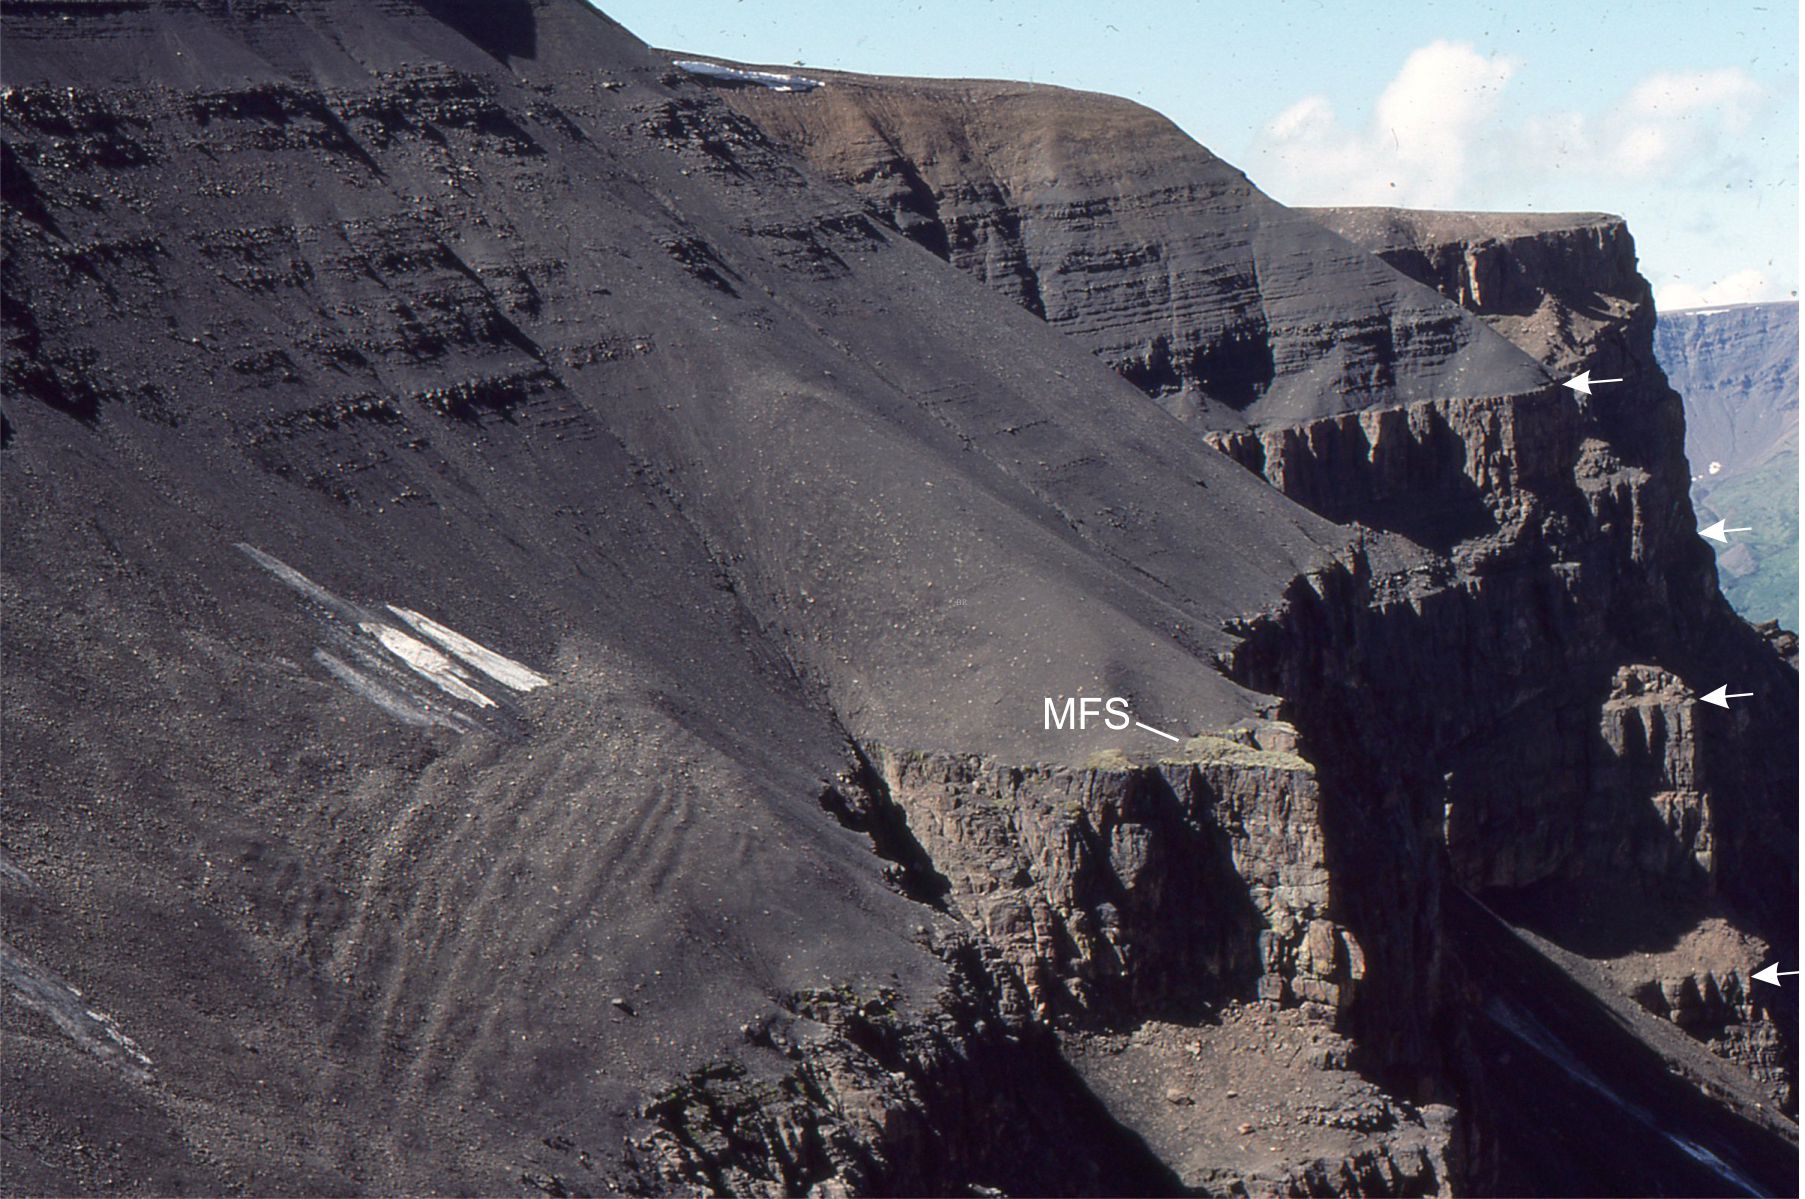
The two examples shown here are typical shelf parasequences bound by flooding surfaces. They correspond to the parasequence segments in the accompanying trajectory diagrams; one (above), a prograding-aggrading succession (normal regression) with an accretionary ascending shoreline transit, the other (below) a down-stepping, accretionary descending trajectory (or forced regression). You can see outcrops of both classes in an earlier post on parasequences.
Notes:
*1 The 2009 paper was presented at the Shelf Edge and Shoreline Trajectory Conference (2007); 15 papers were published in a special volume of Basin Research, 2009, volume 21.
*2 Several contributions in the Basin Research, 2009 volume, including the Helland-Hansen and Hampson paper, emphasize the connections and dynamic links between the trajectories of shorelines and shelf edge clinoforms.
Reference: (Not hyperlinked in the text)
J.R. Curray, 1964. Transgressions and regressions. In, Miller, R.L. Ed. Papers in Marine Geology. Macmillan, p. 175-203.
Other posts in this series on Stratigraphy and Sequence Stratigraphy
Stratigraphic surfaces in outcrop – baselevel fall
Stratigraphic surfaces in outcrop – baselevel rise
A timeline of stratigraphic principles; 15th to 18th C
A timeline of stratigraphic principles; 19th C to 1950
A timeline of stratigraphic principles; 1950-1977
Baselevel, Base-level, and Base level
Sediment accommodation and supply
Autogenic or allogenic dynamics in stratigraphy?
Stratigraphic cycles: What are they?
Sequence stratigraphic surfaces
Stratigraphic trends and stacking patterns
Stratigraphic condensation – condensed sections
Depositional systems and systems tracts
