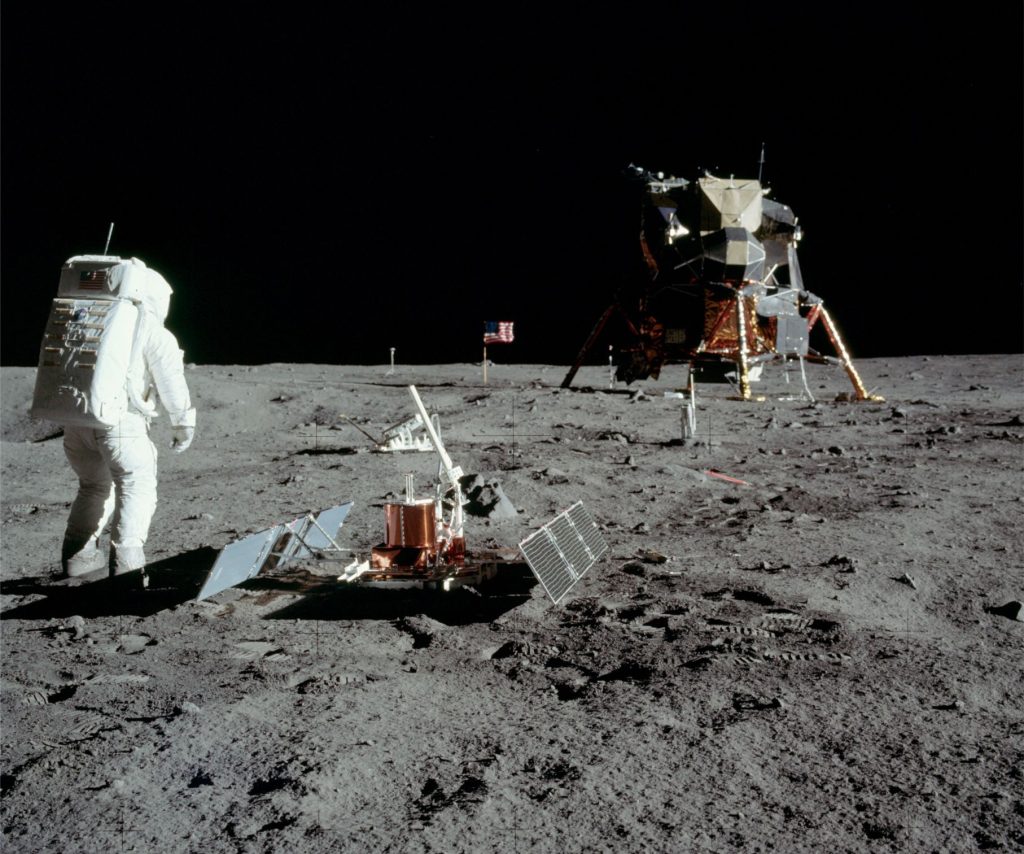
Moonquakes, impacts, and bazookas
The internal structure of Earth is conveniently pictured as a three-layered sphere (or more correctly an oblate spheroid):
- A thin, brittle crust.
- A mantle that is solid but ductile. The crust and lithosphere mantle are organized into tectonic plates that, over the immensity of geological time are continually remade. Partial melting of the mantle is also the source of most intrusive and volcanic magmas.
- A central core composed mostly of nickel and iron, that is itself layered with a solid inner core, and a fluid outer core.
How do we know this?
There is a diverse array of geophysical and geological information that allows us to decipher Earth’s structure, and that of the other planets and their moons:
- Measurement of gravity fields. The strength of a gravity field for any cosmological body depends on the body mass (that in turn depends on volume and density). In general, the larger the mass, the stronger the gravity field. Gravitational signatures within a body can vary because of regional differences in rock density.
- Measurement of electromagnetic fields. Earth’s magnetic field is generated by convective rotation of the hot, fluid outer core. In contrast, neither the Moon nor Mars has an internally generated magnetic field which means that their cores are probably stagnant (that may not always have been the case).
- Heat flow: There are three primary sources of heat in planets and their satellites: Remnant heat from planetary accretion; heat generated by radioactive decay, and heat generated by gravitational tidal forces – the latter may be an important source of heat for magma generation in moons like Io.
- Seismic data generated from natural (earthquakes, impacts) and artificial energy sources (e.g., explosives, airguns) have provided a wealth of information on the internal structure of Earth. Unlike gravity and geomagnetic signals that can be measured remotely, seismic signals can only be recorded by instruments in the field. The first seismic signals ever recorded from a planetary body other than Earth were those from instruments left on the Moon by Apollo 11 astronauts in 1969. Subsequent seismic experiments were installed by Apollo missions 12, 14, 15, 16, and 17. The experiments were terminated in 1977. The only other planetary body for which seismic data is available is Mars – the InSight mission began recording December 2018 and ended December 20, 2022.
The Apollo seismic arrays
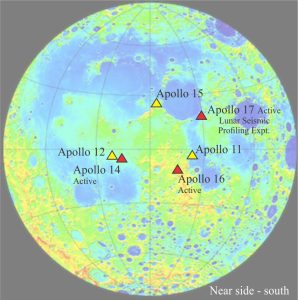
Seismic instrumentation included seismometers at all sites, and geophones at Apollo stations 14, 16, and 17. Passive experiments were conducted at stations 11, 12, 14, 15, and 16; the Apollo 11 experiments only last one lunation in 1969 (one lunar month), the other stations operated until 1977 (passive experiments record natural seismic events, like earthquakes and impacts). Active experiments, using artificial sources of seismic energy, were conducted at stations 14 and 16 (three geophones each in linear arrays), and 17 (four geophones). Two types of energy source were used: thumpers triggered by small explosive charges, and explosives lobbed a few 100 metres from the stations by grenade launchers.
The active experiment at station 17 (Lunar Seismic Profiling Experiment) was designed to explore Moon structure to a depth of several kilometres. Geophones were arrayed in a triangle where apices were 100 m apart with one sensor in the middle of this array. After completion of the experiment the station converted to a passive seismometer. The explosive experiments were initiated after the astronauts had left the Moon (a sensible H & S strategy).
The overall array of Apollo seismometers is important because they allow fairly accurate identification of epicentres (using triangulation) where signals from individual moonquakes are recorded at each station.
The Lunar Surface Gravimeter was installed at station 17 to detect gravitational waves, but it was incorrectly calibrated and failed to produce sensible data. As a backup, it was used as a seismometer.
Moonquakes
More than 13,000 events were recorded over the 8 years of operation, summarized in the list below. There are some interesting comparisons between Moonquakes and Earthquakes (information mostly from Nunn et al., 2020. Open Access).
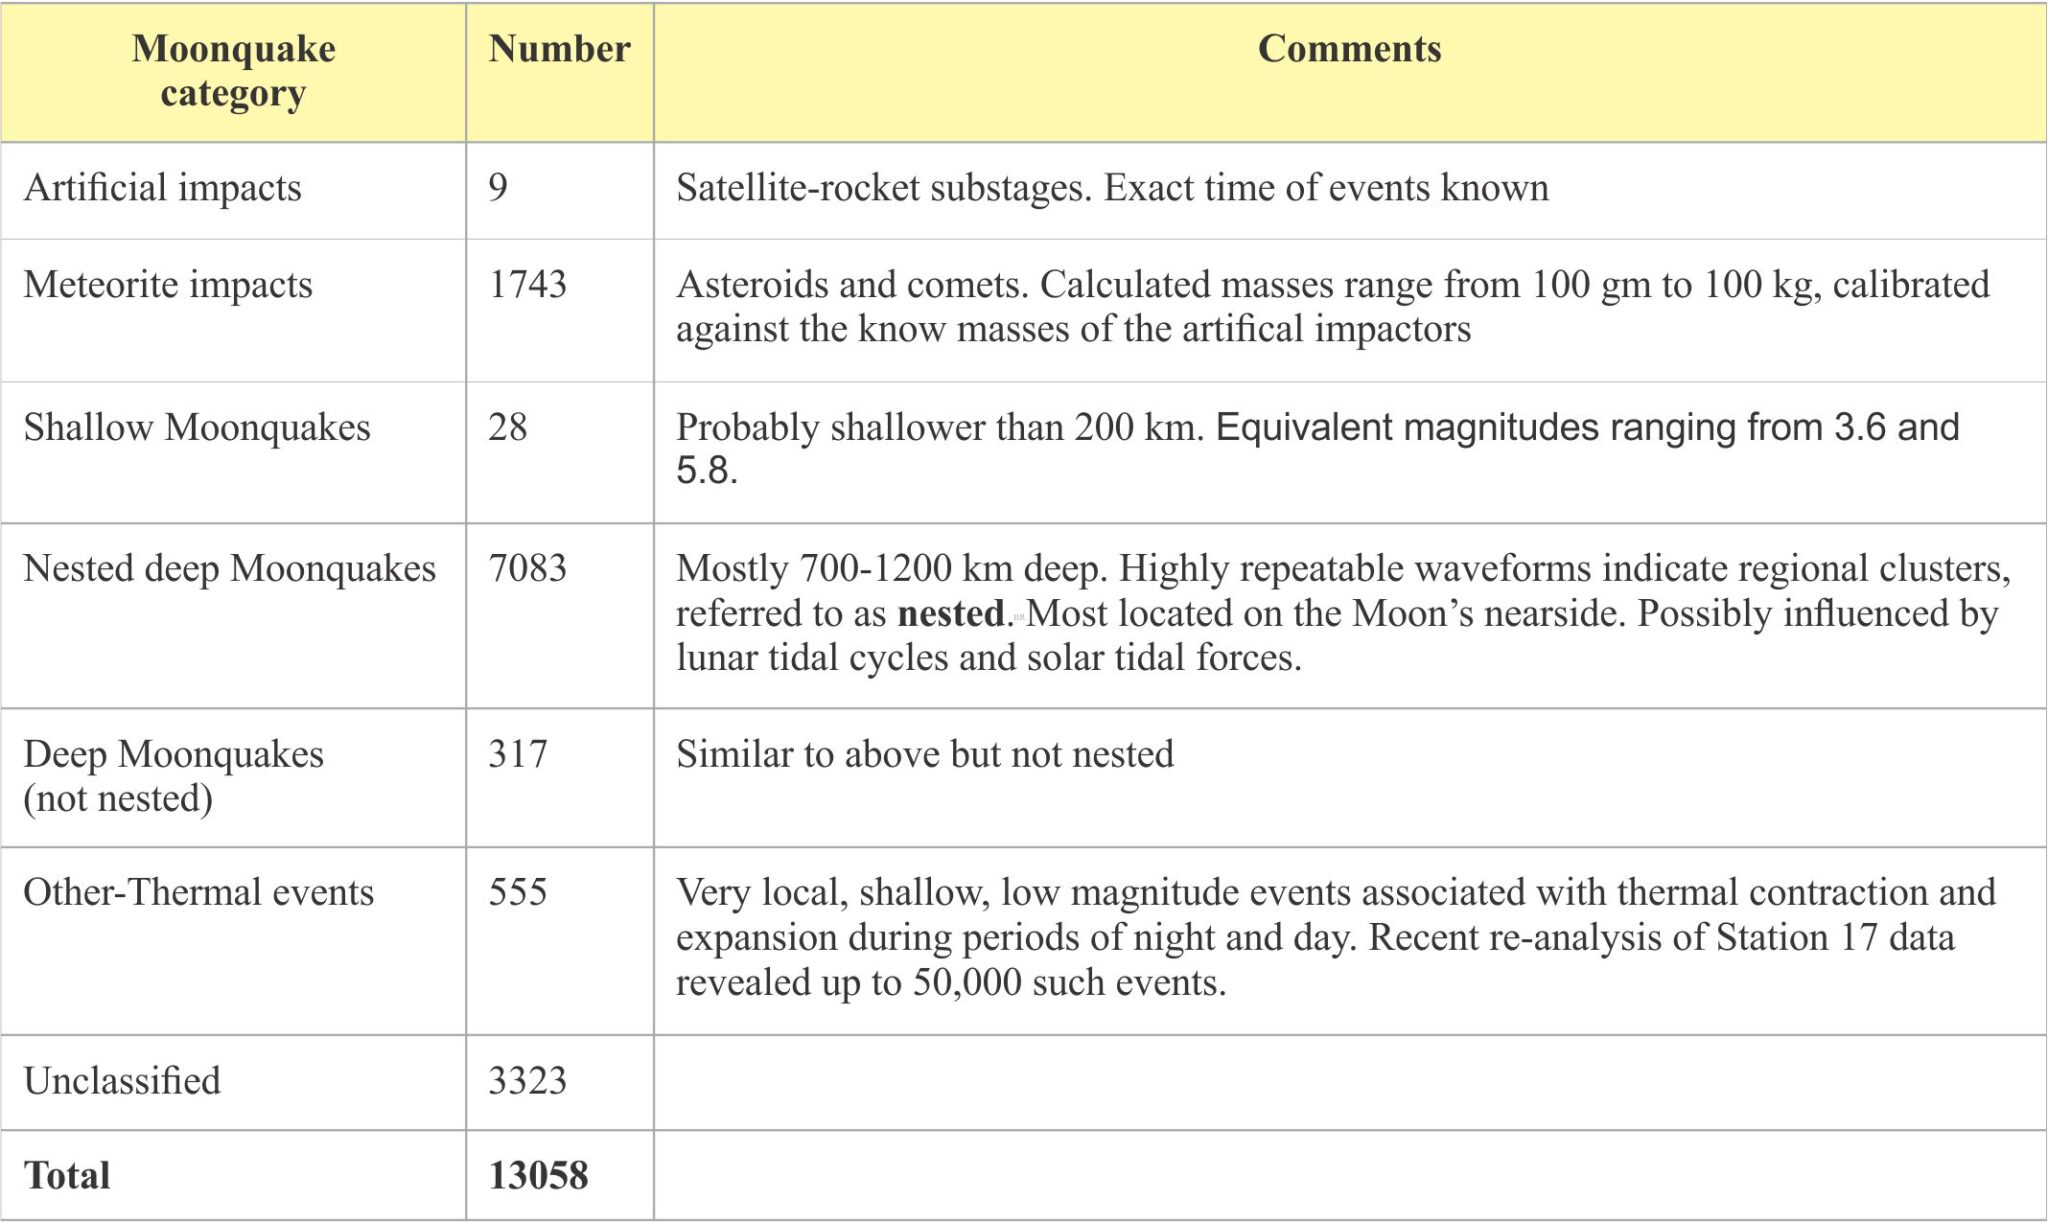
- Moonquakes have long duration after first arrivals, in part because of scattering of seismic (P and S) waves.
- Seismic wave scattering is probably due to the intense impact fracturing of the upper few hundred metres of Moon crust. Scattering produces a kind of ringing, or echo effect that is referred to as seismic coda (coda is a term used in music composition to indicate a repeated theme).
- The high number of impact events reflects the absence of a lunar atmosphere (on Earth most meteorites burn up or fragment).
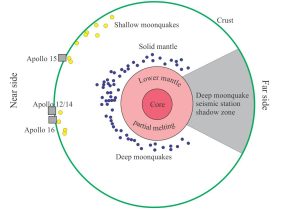
- Shallow crustal events (shallower than 200 kilometres deep) are rare compared with Earth, reflecting the absence of plate tectonic processes in the Lunar environment. Shallow event signals are similar to intraplate Earthquakes. Magnitudes as high as 5.7 were recorded. No (gravitational) tidal periodicity has been identified in any of this data.
- Deep Moonquakes are most numerous. Most occur between 700 and 1100 kilometres and have magnitudes less than 3. There is a periodicity to clustered (locally nested) events with strong peaks at 13.6 and 27 days, that are attributed to tidal phases of the Moon. Addition periodicities at 206 days and 6 years are attributed to solar tidal influences.
- A significant number of very low magnitude, local events are attributed to diurnal thermal expansion and contraction. Recent reprocessing of Station 17 data shows more than 50,000 of these events occurred over 8.3 months (Nunn et al., 2020, op cit.). The acme of thermal Moonquakes coincides with the lunar sunrise and sunset.
- Artificial impact events were generated by crashing satellite substages onto the Moon surface.
Lunar structure: topography and geomorphology
Detailed mapping of Moon topography has been a primary mission task of the Lunar Reconnaissance Orbiter, operating since September 2009. Impressive colour enhanced compilations of the near (visible) and far side topography show marked differences in relief and geomorphic structure between the two sides. Because Moon is almost a perfect sphere, positive and negative differences in elevation are measured from a datum that corresponds everywhere to an average radius of 1737.4 km. The difference between the lowest and highest elevation points is about 18,000 m.
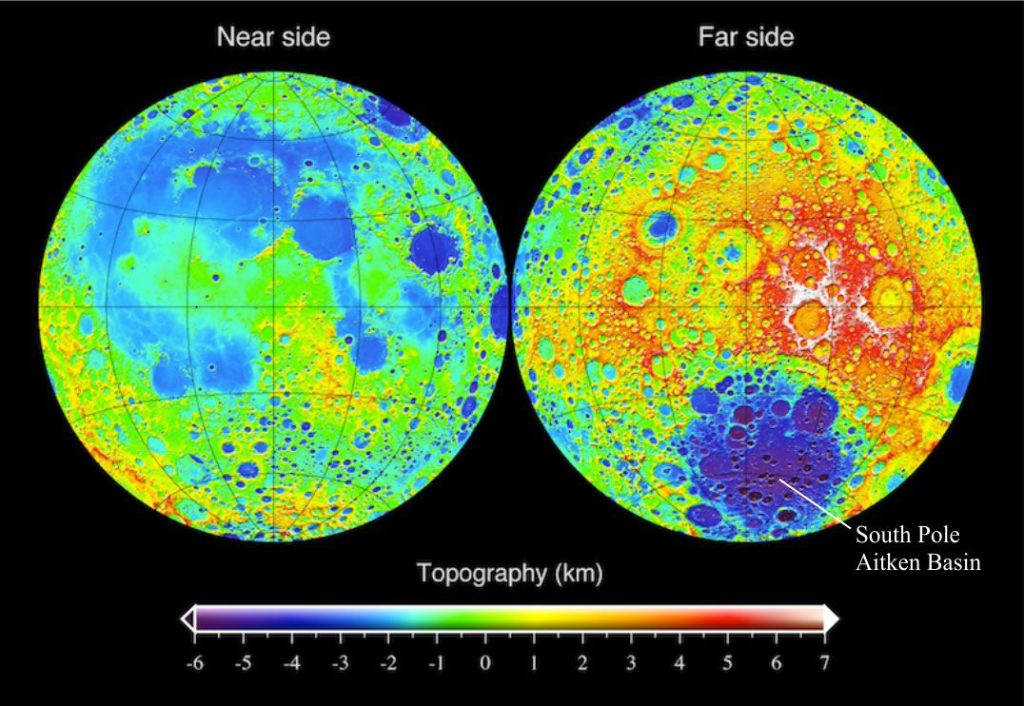
The visible surface of the Moon is made up of two main geomorphic elements:
- Broad, relatively flat impact plains, or maria (singular mare) underlain by extensive basalt lava flows and lava tubes (these are the large dark splodges visible from Earth, interpreted as oceans or seas by enlightenment astronomers, hence the name – mare). Most formed from catastrophic impacts 3.1 to 3.9 billion years ago, and as such are some of the youngest lunar surface structures. Some are multi-ring impact structures. Extrusion of basalt lavas may have resulted from initial impact melts, but it seems that eruptions also continued long after impact, possibly triggered by later heating events. Most maria are located on the moon’s near side. A very large mare near the south pole of the far side has depths of 10 km (this is the South Pole Aitken Basin). Basalt mineral composition based on Apollo samples shows predominantly clinopyroxene, calcium plagioclase, olivine, and iron–titanium oxides like ilmenite and spinel.
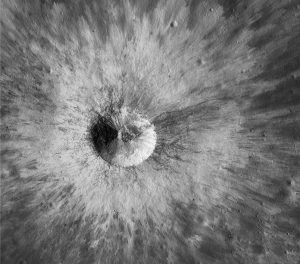
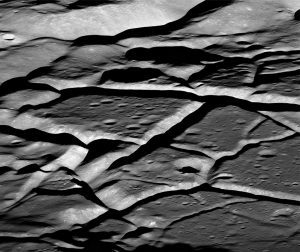
- Rugged, mountainous Highlands pockmarked by a myriad craters. Highland regions are most pronounced on the Moon’s far side where elevations reach 8-10 km above the lunar datum. Most of this ruggedness is a result of impacts – a combination of post-impact rebound and ejecta fall-back. The effects of successive, repeated impacts resulted in dissection of landforms, intense brecciation, melting, and shock metamorphism of bedrock. Thus it is likely that the original crustal bedrock has been reworked numerous times, a process called impact gardening (Pernet-Fisher and Joy, 2016). Attempts to decipher the original composition of the crust in highland regions need to “see through” these structural and geochemical changes.
Layered structure of the Moon
Regolith and megaregolith
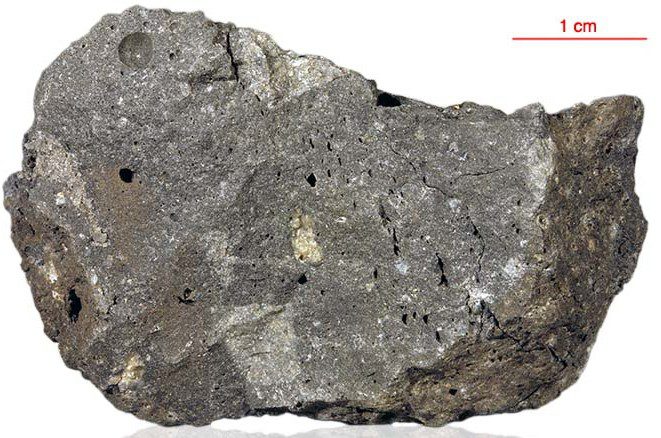
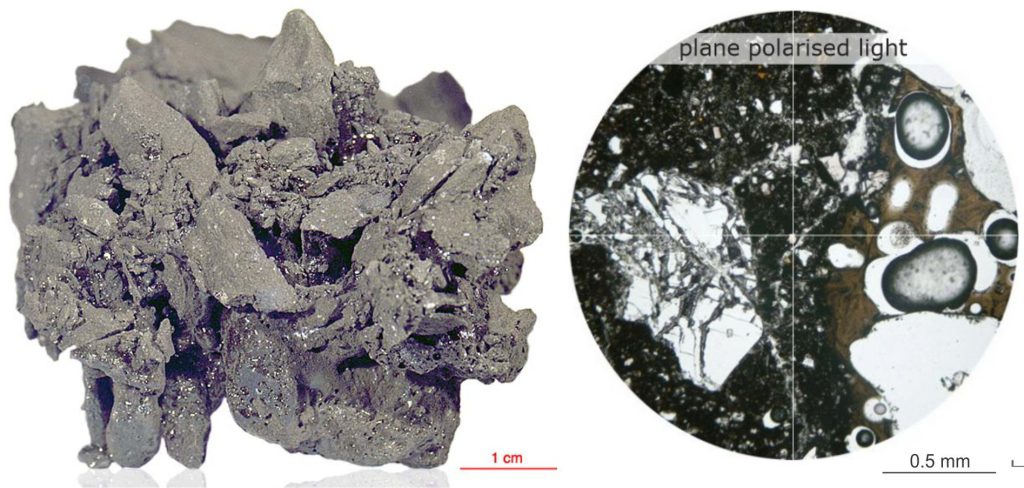
The entire surface of the Moon is covered by a regolith veneer, averaging 4-5m thick. It consists of intensely fractured and brecciated bedrock (basalt, anorthosite), crystals derived from bedrock, dust, glassy welded agglutinates, and impact glass (Noble 2009, PDF available). Breccia compositions, based on Apollo samples, range from friable aggregates to hard, glassy, vesicular rock. Porosity at the surface is as high as 50%. Accordingly, seismic velocities range from 0.1 to 0.3 km/s.
Megaregolith applies to much thicker deposits associated with large impacts in the Highlands. Thicknesses are uncertain, but on a volume basis could be greater than 2.5 km.
Lunar Crust
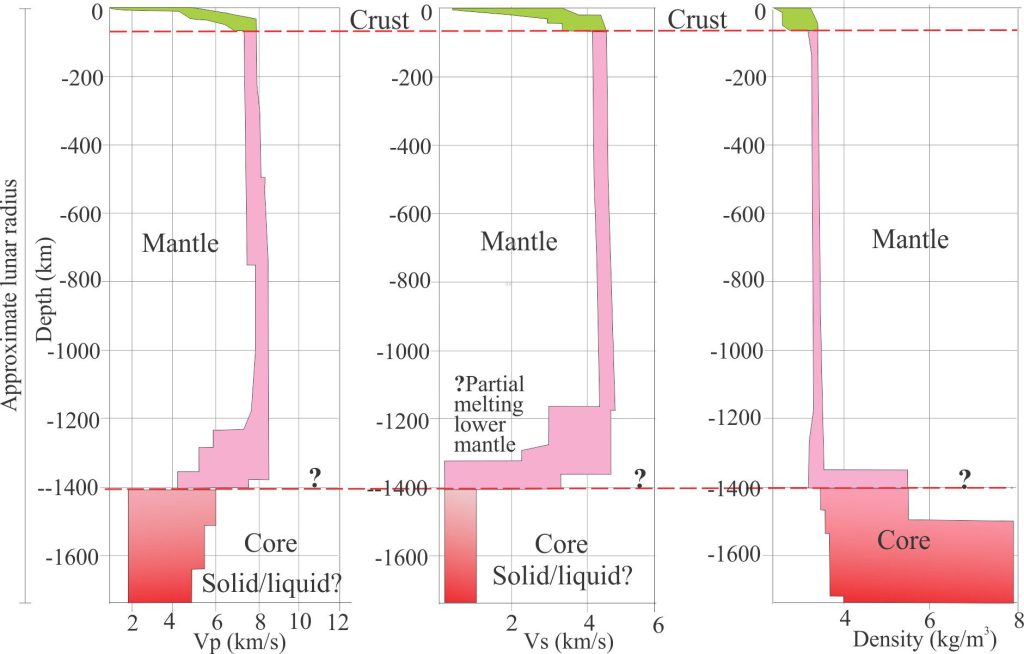
Models of crustal thickness vary from 34 to 43 km and 30 to 38 km, depending on the use of gravity or seismic data (see Garcia et al., 2019 for discussion). The average bulk density is 2550 kg/m3 based on gravity models. Thickness values for the far side are about 15 km greater than the near side.
Seismic P and S wave velocities increase steadily through the upper 20-25 km of crust, below which P wave velocities increase abruptly to 6.8 km/s and continue at this value to the base of the crust (Garcia et al., op cit. Figure 4); the velocity corresponds to that expected in an anorthosite crust. It is hypothesized that the acoustic boundary at 20-25 km corresponds to the depth of impact fractured crust.
Lunar mantle
P wave velocities of about 6.8 km/s and S wave velocities about 4.5 km/s continue to depths of 1200 km, whereupon there is a fairly abrupt decrease in P and S wave values (the deep Moonquakes range from 700-1100 km depth). Garcia et al., (op cit.) note that there are significant uncertainties with seismic data below 1200 km. The mantle is probably silicate-rich, represented by olivine- and pyroxene-rich rocks, with relatively consistent densities of 3.4 to 3.5 kg/m3. There is no evidence for convective overturning in the mantle. However, S wave attenuation near the base of the mantle may indicate partial melting.
Lunar core
The important seismic attribute of the lunar core is that P waves are transmitted through, but S waves are not. This means that either the entire core is liquid, or that it has a liquid outer shell. Recent models tend to favour a small liquid core ranging from 300 to 350 km diameter, surrounded by a liquid shell 90 to 220 km thick (Garcia et al., op cit.). All evidence indicates an iron-rich core. Core density is probably in the region of 7.8 kg/m3.
Postscript
With all the current and planned activity, lunar accommodation and parking space will become a premium. Lunar Reconnaissance Orbiter will continue mapping and looking for locations suitable for possible extended habitation. The recently inserted Indian satellite Chandrayaan-3 will presumably undertake similar tasks, with a lander near the South Pole. China has successfully landed the first rover (Chang’e-4 spacecraft) on the far side. All this activity is ostensibly of a scientific nature, but it would be naïve to think that geo-lunar political considerations are not part of this mad lunar rush, on the heels of a post-Apollo hiatus of more than 40 years. Let’s hope that science remains the primary rationale for all this effort and expense, that the Moon doesn’t become yet another garbage dump of human folly.
