Seamounts and volcanic islands – the foundations for atolls and fringing reefs.
A historical interlude
Darwin’s elegant explanation of atoll formation has largely stood the test of time and critique – at least until recent challenges. The Darwinian dogma maintains that atolls begin life as reefs that fringe oceanic, volcanic islands. As the volcanic edifice subsides, the separation of reef from shoreline increases. Eventually the volcanic foundation disappears beneath the waves and the encircling reef complex envelops a relatively shallow lagoon. A recent challenge to this general hypothesis by Droxler and Jorry (2021, OA) links modern atoll growth to relatively short-period sea level fluctuations driven by Quaternary glaciations.
In detail this revision may be correct, but it does not invalidate the central theme of Darwin’s hypothesis, that reef growth keeps pace with relative changes in sea level, whatever the driving mechanism and periodicity – a sensible idea that has modern overtones. What Darwin didn’t do was explain how the volcanic edifice got there in the first place – not surprising given that very little was known about the deep ocean floor at that time.
![Darwin’s barrier reef – atoll succession copied from his 1888 edition of Journal of Researches into the Natural History and Geology of the Countries Visited During the Voyage of H.M.S. Beagle Round the World, page 474, John Murray, London.
[Darwin’s original The structure and distribution of coral reefs, 1842, is reproduced by Darwin Online]](https://www.geological-digressions.com/wp-content/uploads/2024/07/seamount-darwins-atoll-1024x515.jpg)
[Darwin’s original The structure and distribution of coral reefs, 1842, is reproduced by Darwin Online]
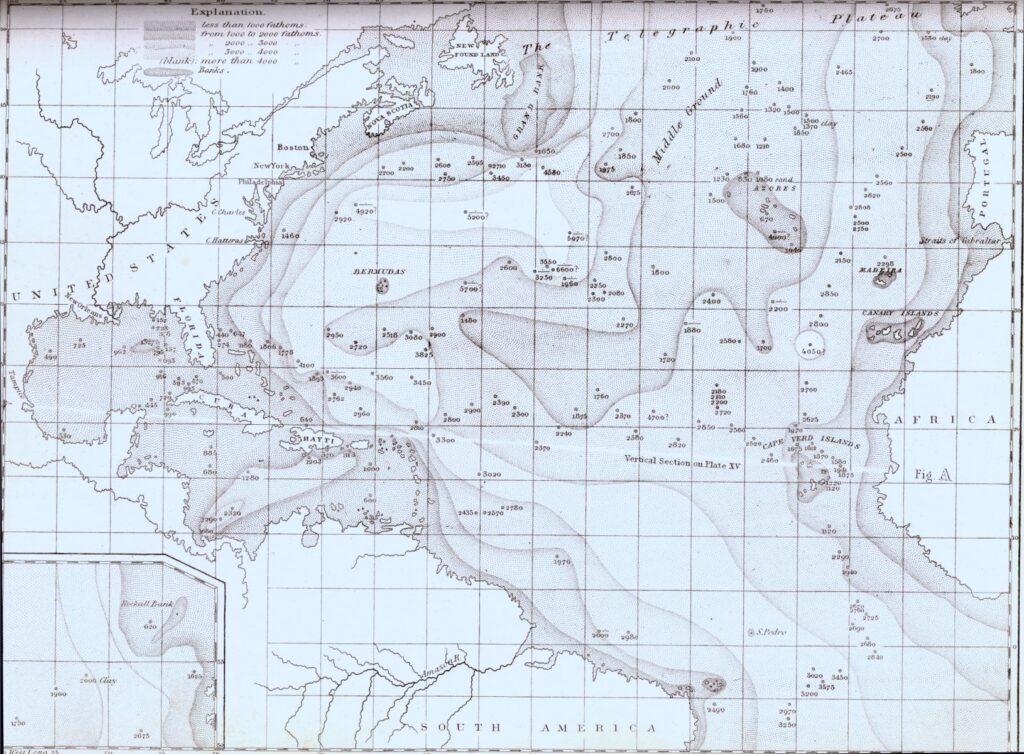
Prior to the 19th C, and even as late as 1878 if remarks by Louis Agassiz are taken at face value – “The monotony, dreariness and desolation of the deeper parts of the submarine scenery can scarcely be realized…”, ocean deeps were regarded as fathomless wastes – fathomless in the context of our understanding and imagination, and fathomless in the sense of measurement (quote from A.E. Theberge, 2016, Hydro International).
It wasn’t until the 1840s that the first bathymetry measurements and profiles were recorded by James Ross in 1840, and US Navy surveyor Matthew Maury in 1849 (Dierssen and Theberge, 2014). At that time, the only way to do this was by painstakingly throwing a length of weighted rope overboard, waiting till it hit bottom then moving to the next measurement site. Matthew Maury was also involved in Atlantic bathymetry profiling during the HMS Challenger Expedition (1854). On this cruise they carried 291 km of hemp just for this purpose. It was this expedition that identified the mid-Atlantic Ocean mountain range – the first inklings of what we now call the Mid-Atlantic Ridge (that later was discovered by Marie Tharpe and Bruce Heezen to have a central rift complex). Dierssen and Theberge (op cit.) note that the measurement error for these depths (>2000 m) was about +/- 100 m, which is actually pretty good considering it was often difficult to determine when the weight had hit bottom. Other errors included correcting for boat and deep current drift. Hemp rope was later replaced with piano wire that, because of its small diameter and smooth surface, vastly improved the operation.
A Swedish expedition in 1869 attempted to dredge the Atlantic seafloor about 370 km west of the Portuguese coast. At one location, they anticipated depths to be about 3660 m, but the dredge bottomed out at about 180 m. This was the first discovery of a mid-ocean seamount. Sediment samples also revealed a wealth of microscopic and macroscopic critters, including corals from the tops of seamounts discovered in the Pacific by Lieutenant G. Belknap on the USS Tuscarora in 1873 (Theberge, 2016, op cit). The ocean floor was alive!
Harry Hess
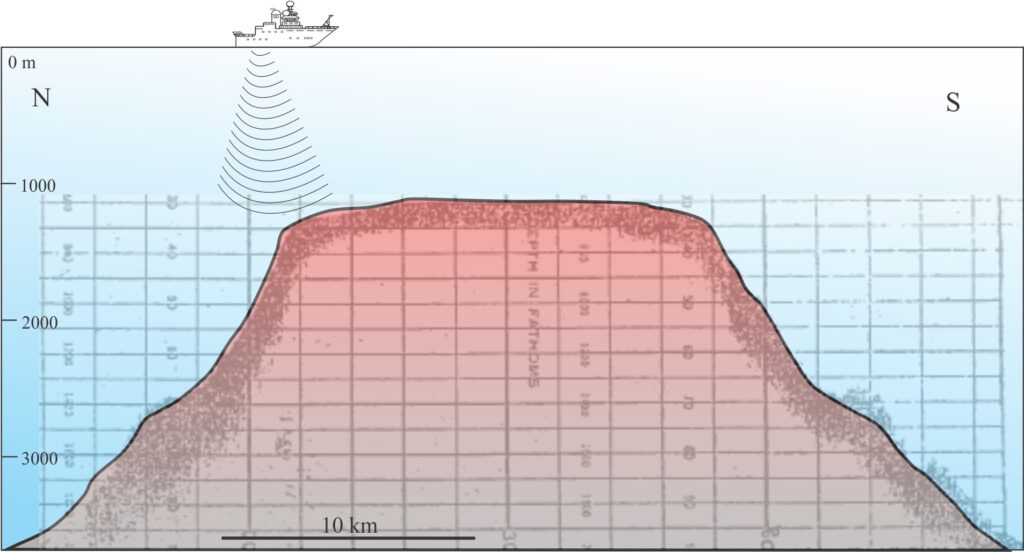
Hess is usually credited with the first interpretation of seamounts as oceanic volcanoes (Hess, 1946). This was based on fathometer profiling of the sea floor during his WWII US Navy service in the northwest Pacific. Sonic methods of underwater detection, better known as SONAR, were vastly improved during the war period. Hess later retrieved those records that profiled 160 seamounts along a traverse between Hawaii and the Mariana Islands. They were characterised by slopes rising steeply from the sea floor. Many had flat tops – he named these guyots after the Swiss-American geographer Arnold Guyot. The apparent truncation of these edifices was a puzzle – they appeared to be erosional, but at water depths up to 1000 m? He ventured the possibility that sea levels were much lower in the geological past, and that the guyots were very old, maybe even Precambrian (keep in mind that the advent of plate tectonic theory was still two decades away). Hess commented that the seamounts were older than the atolls that adorned them in the Marianas.
The real revolution in ocean exploration began in the mid-20th C. Much of the new-found knowledge was predicated on the demands of the changing technology of warfare. The initial impetus was detailed bathymetric mapping during World War II, particularly for the rapidly developing technology of submarine warfare. Unraveling the oceanic gravity and magnetic signatures was a later requirement for the more modern tools of destruction, global communications, the transport of goods and people, and space exploration. We now know a great deal more about the oceans than our 19th and early 20th C heroes, identifying:
- Continental shelves and slopes.
- Mid-ocean spreading ridges and fracture zones.
- Trenches and subduction zones.
- Abyssal plains and platforms, and
- More than 200,000 volcanic seamounts (Koppers and Watts, 2010, PDF).
Seamounts
Venture 1 km from the reef off the southeast corner of Aitutaki near atoll (Cook Islands group) and water depths have plunged almost 1000 m; at 10 km there is nearly 3000 m of water beneath you. The island’s base is 40 km wide where it meets the 4000 m isobath, and in map view it is approximately circular. Its highest elevation is 123 m above sea level. Aitutaki is a typical volcanic island. Seamount heights range from a few 100 m, to over 8000 m where the edifice pokes its vent above the waves. Hawaii, one of the largest seamounts, is about 100 km diameter. They are similar to terrestrial shield volcanoes in size and gross morphology.
Active seamounts are found in the middle of oceanic plates and close to plate margins; flanking mid-ocean ridges, subduction zones, and along fracture zones. Some are subducted, for example the Hikurangi subduction zone beneath eastern New Zealand (Pedley et al., 2010 PDF).
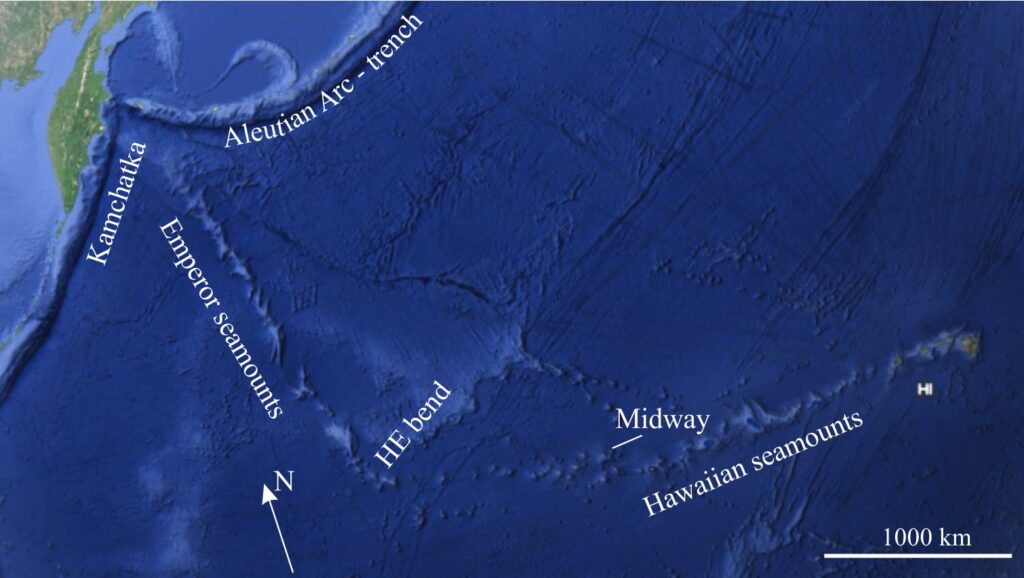
Seamounts that have attracted much attention are those that occur in trails, or chains. The Hawaiian-Emperor chain is probably the best known. There are at least 90 seamounts and volcanic islands along the 6000 km trail, arranged in a remarkably consistent age progression from the oldest at >82 Ma (Meiji Seamount), to the currently active Kilauea. What makes this seamount chain so interesting is the 60o bend in the otherwise linear trend. The ‘bend’ has been interpreted as a change in ocean plate trajectory relative to the hotspot at about 47 Ma. (Koppers and Watts, 2010, op cit.; Torsvik et al., 2017; OA).
Rock sampling and gravity profiling indicate seamount densities and compositions consistent with mafic intrusions and extrusive volcanics. Most have a carapace of volcaniclastic and pelagic sediment, and in tropical realms coral reefs fringe exposed margins. Local gravity anomalies indicate significant excess mass on normal oceanic crust. Flexural loading by the island mass results in a deepened moat bound seaward by a peripheral bulge. The moat-peripheral bulge pair was first identified in the Hawaiian seamount chain but has since been found associated with other seamounts. The example shown below from Tenerife (Canary Islands) is from Koppers and Watts, op cit, Fig. 5.
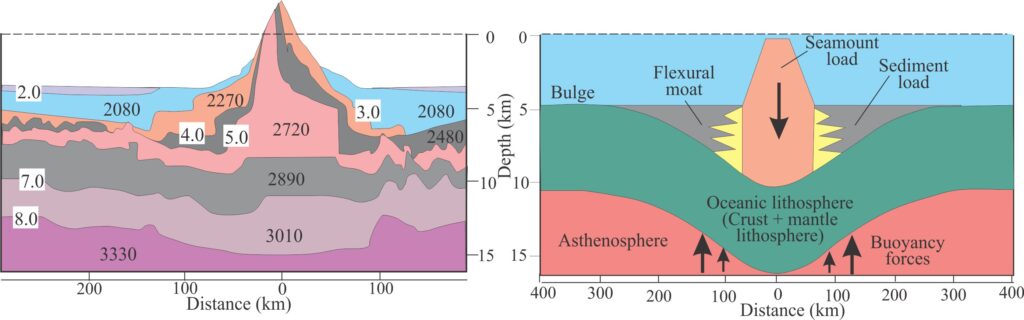
Right: A model of lithospheric flexure driven by the seamount load, balanced by buoyancy forces generated in the asthenosphere. The flexural response has created a moat filled with sediment derived from the seamount (plus pelagic sediment), and a peripheral bulge. The wavelength of the bulge is about 300 km. Both panels redrawn from Koppers and Watts, 2010, Figure 5. Note the different horizontal scales on each panel.
Flat-topped seamounts, the guyots of Hess, look like someone has taken a gargantuan pair of scissors to the top of the edifice. The morphology is usually attributed to subaerial exposure and wave planation. Many Pacific seamounts are adorned with reef corals, at depths well beyond the limits in which corals thrive, and significantly deeper than can be explained by falling eustatic sea levels. Both attributes indicate that island-seamount subsidence continues long after volcanic activity has ceased.
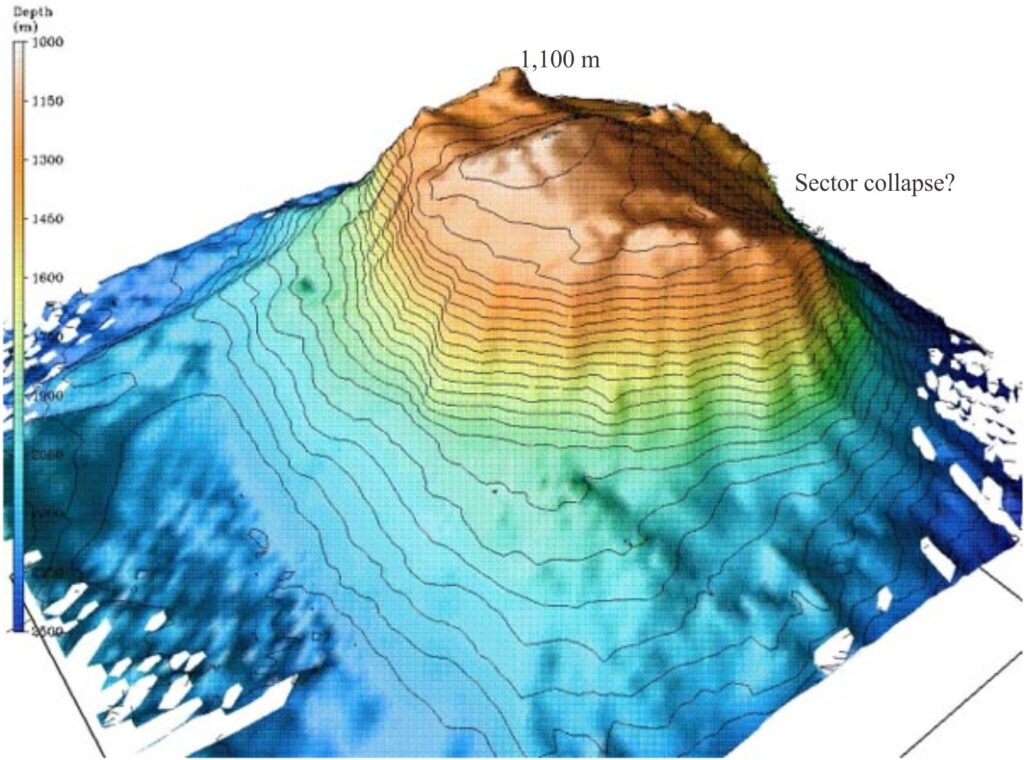
Seamount morphology can also be modified by mass wasting, specifically slope failure. The large, scallop-shape indentations seen in many slope profiles and images are attributed to sector collapse. Failure can occur while the seamount is active or long after active growth. Sector collapse will inevitably produce submarine debris flows, turbidites, and mass transport complexes. Large failures may even cause tsunamis. One of the better-known examples is the landslide and submarine sector collapse on Tenerife, Canary Islands.
Biostratigraphic and magnetostratigraphic analysis of deposits like these also help unravel the life cycle of seamounts. An example of this has been documented from the Great Meteor-Cruiser seamount complex that borders the North Atlantic mid-ocean ridge, where the flanking turbidite succession records successive slope failures (Hunt and Jarvis, 2020, PDF).
Seamount rock compositions
The volcanic contribution of mid ocean seamounts and volcanic islands is small (<1%) compared to plate boundary volcanic domains (spreading ridges and island or continental arcs). Minimalist ranking aside, they are important because:
- They provide windows to deep mantle composition and processes (Koppers and Watts, op cit.)
- They are central to evolving theories of mantle convection and plate trajectories (e.g., Tuzo Wilson, 1963; Greenough et al., 2005).
The dominant rock type is basalt. Mineral compositions indicate relatively primitive magmas that rise as plumes and reflect derivation directly from the deep mantle, in contrast with subduction-related magmas that commonly represent partial melting in the upper mantle lithosphere and lower crust. This is reflected in the relative enrichment of seamount rocks in rare earth elements (REEs) compared with mid-ocean ridge basalts that are probably derived from upper mantle sources already depleted in REEs.
[REEs are a group of metals including 15 lanthanides plus Scandium (Sc) and Yttrium (Y). They are critical components of modern electronic technology]
It is generally argued that seamount magmas originate in the deep mantle and probably as deep as the core-mantle boundary. Magmatic differentiation in the lithosphere, caused by pressure drop and cooling, produces two main compositional rock types – tholeiitic basalts and alkali basalts. The mineralogical distinction between the two is based mainly on the presence of nepheline, alkali feldspar, absence of quartz, and common ultramafic zenoliths (inclusions) in the latter. Both types contain olivine and pyroxene (mostly augite and hypersthene), and chemically distinct plagioclase, chromite spinels, and magnetite (see Tables 1 & 2 in Greenough et al., op cit.).
Tholeiitic basalts tend to crystallize at lower pressures than alkali basalts in the lithosphere. To some extent this is dependent on the thickness and density of oceanic crust and mantle lithosphere. Close to spreading ridges, the oceanic lithosphere is thin and relatively warm. In this case, pressure loss in the rising plume generates huge volumes of tholeiitic basalt. Farther from the spreading ridge, the magmatic plume rises through older, thicker, and higher density oceanic lithosphere such that differentiation to alkali basalt occurs at greater depths (Greenough et al., 2005).
Hotspots and seamount dynamics
J. Tuzo Wilson (1963), like many geologists and geophysicists in 1950s – early 1960s, grappled with the central problem of Earth dynamics – was Earth a rigid sphere or was it mobile? Continental drift theory was central to those with mobile tendencies. There was also mounting evidence for deep-seated processes in the mantle, principally convection (e.g., Arthur Holmes, 1946). By the early 60s there was a definite shift in favour of a mobile world encompassing its continents, ocean basins, volcanic arcs, and mountain belts. Wilson’s 1963 paper on seamounts helped cement these views; it also became a central theme for the nascent plate tectonic theory.
Wilson proposed that intra-ocean volcanic islands and seamounts were the products of mantle plumes, separate and distinct from the more obvious volcanic arcs that rim several ocean basins. He used the example of the Hawaiian volcanic island chain that shows a remarkably linear progression in age from the currently active Kilauea to the older, more dissected Kauai. We now know that this chain extends along the Hawaiian Ridge to the Emperor Seamount chain and includes at least 90 dormant or extinct volcanic centres. Wilson explained the age progression as the product of mobile ocean crust moving over a stationary plume – now referred to as the hotspot theory. His Figure 1 shows the relative motion of mobile Pacific Ocean crust for 9 seamount trails, each trail fed by an hypothesized mantle plume.
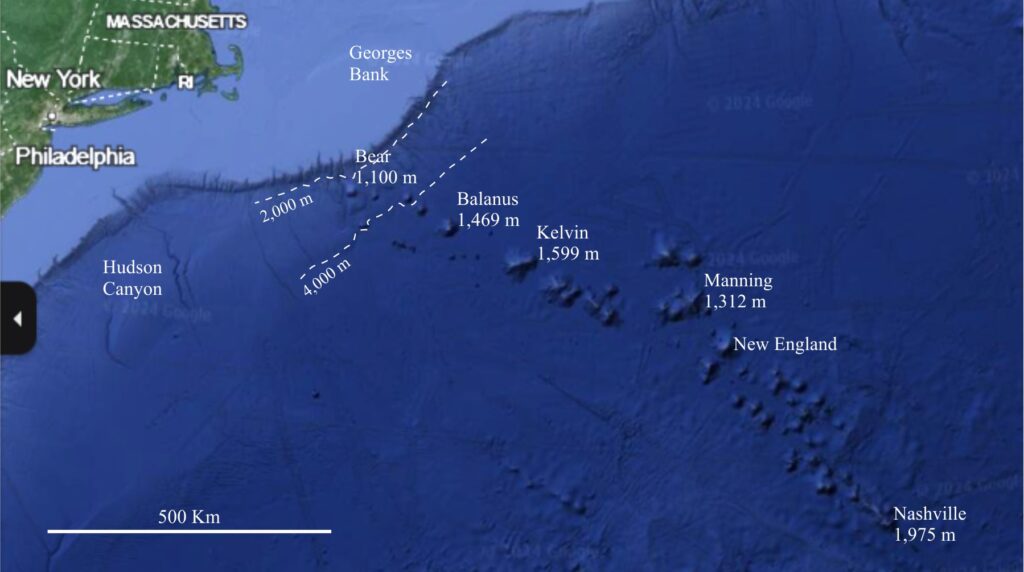
Equally fascinating is the New England chain of 30+ seamounts, stretching southeast into the Atlantic about 1100 km from the USA Eastern seaboard – Georges Banks. Seamount ages progress seaward from about 103 Ma at Bear Seamount close to Georges Bank, to 83 Ma at Nashville Seamount (Kinney et al., 2021). However, magma intrusion began about 124 Ma at a time when the North American craton lay directly over the mantle plume. Felsic and mafic intrusions underlie the White Mountain region (part of the Appalachians), the products of significant differentiation as magma rose through the lithosphere. North America subsequently moved westward in concert with production of oceanic lithosphere and extrusion of the eastward-younging seamount chain (Eby, 1995).
Wilson’s hotspot theory has largely stood the test of time, augmented by plate tectonic theory. Seamount trails are regarded as important signals of relative plate motion. Again, the Hawaiian-Emperor chain has attracted attention because the locus of the trail bends at a point between Callahan and Koko seamounts. The corresponding K-Ar and 40Ar/39Ar ages at the bend hover about 47 Ma, marking initiation of Hawaiian volcanism. The standard interpretation of the bend is that motion of the Pacific plate rotated eastward relative to the hotspot.
Are mantle plumes really stationary?
The idea that hotspots are stationary has been challenged. More recent seismic profiling and modeling predict that plume geometry is more complex and variable. Rather than a simple, vertical magma injection, plume trajectories and geometry may change during the life of a plume. Thus, plumes may migrate independently, and at rates about the same order of magnitude as the rotation rates of the ocean plate they intrude (Koppers and Watts, op cit.). This is demonstrated again by O’Conner et al., (2013, OA) who modeled the relative motion between the Hawaii-Emperor and Louisville seamount chains and predict about 300 km of hot spot relative motion between 80 and 47.5 Ma. In this case, the Hawaii-Emperor bend can be interpreted as plate adjustment to deep-seated changes in plume configuration and location, rather than just plate motion.
- More problematic is the multitude of solitary seamounts, and the seamount chains where there is no age progression. Explanations for these occurrences include:
- Proximity to leaky fracture zones and transform faults.
- Extension fractures caused by crustal flexure – this might apply to seamounts close to ocean trenches where extension occurs above a subducting slab.
- However, many solitary seamounts have no obvious fracture or fault zone foundation. Does each of these require a single plume, or a more extensive zone of melting near the base of the lithosphere (Watts, 2019, PDF)?
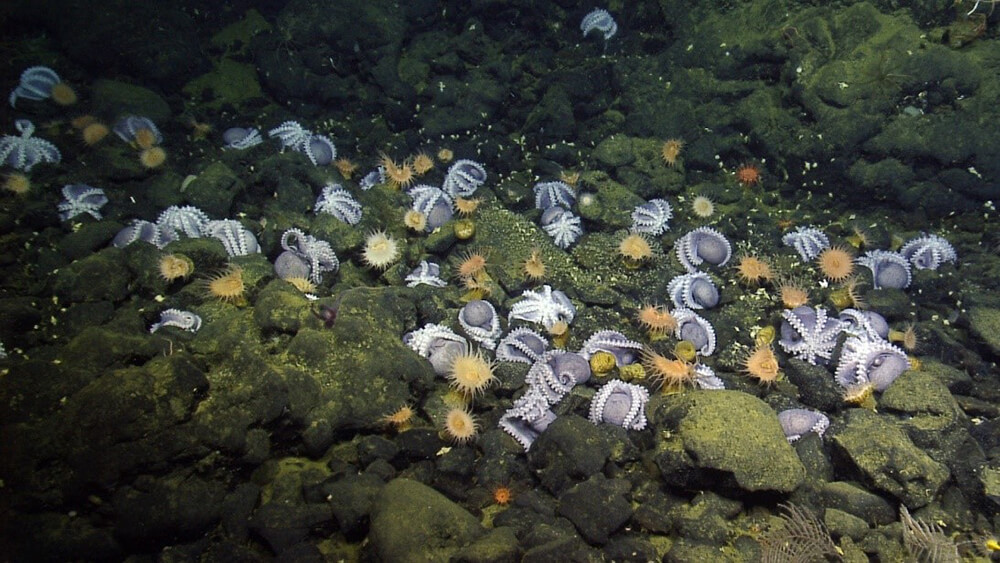
Seamount ecosystems
Seamounts, even those much deeper than the photic zone, are domicile to diverse species of fish, corals, sponges, crustaceans, echinoderms, octopuses and squid. These ecosystems are fragile. Many of the organisms are slow-growing, with reproduction rates that span decades. Over-fishing, particularly the bottom-trawling kind, has the potential to obliterate these ecosystems. The New Zealand Orange Roughy fishery is a classic example of mismanagement and scientific ignorance. Orange Roughy is a slow growing, deep water species. The late 1970s – 1980s saw a boom in Orange Roughy fishing at catch rates where over-fishing and species decline was inevitable. The problem for the fishery is that reproduction of this species is limited to adults 20 years old and more. To make matters worse, bottom trawling destroys much of their food source. Reasonably sustainable fishing quotas for this species are now in place. There are indications of recovery.