So you think sea level is the same everywhere!
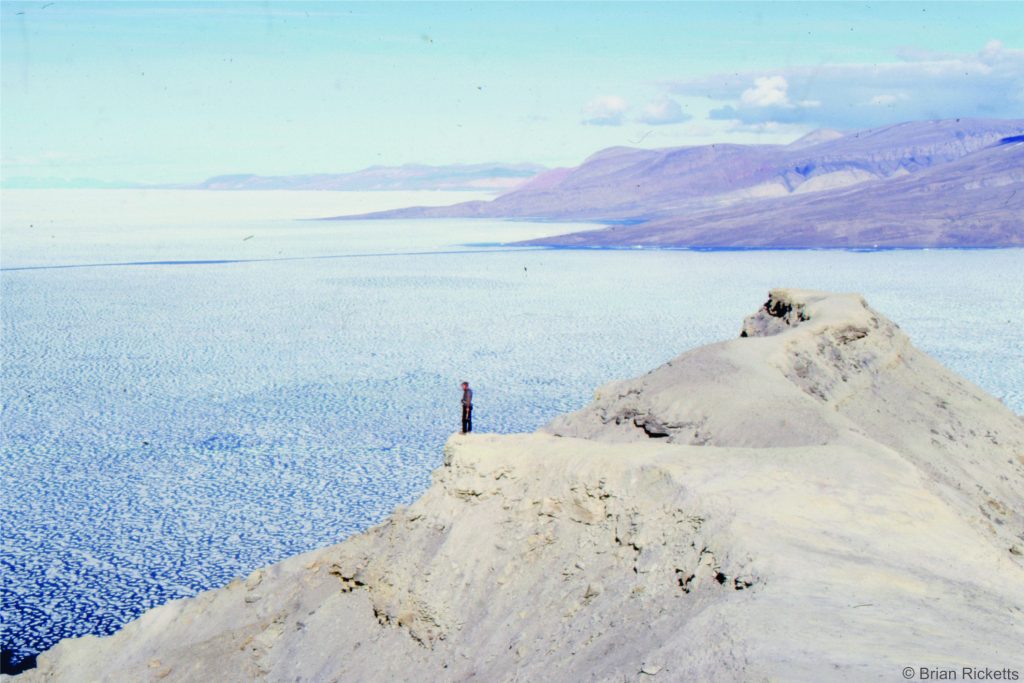
Climate change predicts that sea levels will rise at an increasingly rapid rate. Some of NASA’s new satellite altimetry data hints that this is already happening. There is a multitude of voices crying out for government planners to prepare for inundation of vulnerable coasts. Small island states are particularly at risk. Forward planning would certainly be a wise move. If average sea level rises say a metre in the next 100-200 years many coasts will be inundated and storm surges will push farther inland. Forward planning does make sense.
But…
There is one “but” in all this; we need to know what sea level, and importantly what sea level rise really means. For sea level to rise globally there needs to be an increase in the volume of the oceans. It is generally understood that this is accomplished in two ways:
- Melting ice sheets provide additional water to the oceans, and
- Oceanic water masses expand because of an increase in temperature (this is called the steric or thermosteric effect).
From a purely psychological perspective it is reasonable to assume that sea level is the same everywhere and if sea level rises or falls then it will be the same rise or fall everywhere. Well guess what! This is not the case.
1 Sea level is not the same everywhere, and
2 Sea level rises (or falls) will be different over different regions of the earth. In other words, a one metre rise in the global average sea level DOES NOT mean that every coastline will experience a one metre rise. Some may experience a sea level fall, some no change at all. This does seem counterintuitive. Nevertheless, there are sound scientific reasons for this.
This post looks at some of the complications that scientists need to consider when they attempt to predict the sea level rise that is a consequence of climate change. From a purely scientific perspective, these complications make the problems more challenging and more intriguing.
Sea level is not the same everywhere
We know that the Atlantic and Pacific oceans have different average sea levels. This fact is nicely illustrated in Central America where there is a 20cm difference between the two oceans at either end of the Panama Canal. This is one reason why locks are required along the canal, in part to cope with different tides, but also the difference in sea level.
However…
Even within a particular ocean, like the Pacific, there are significant regional differences in sea level. The culprit is – gravity.
Newton’s apple
The effects of gravity are not the same everywhere. Gravity as a force (that prevents you from bouncing off into space) depends largely on the density and distribution of materials like rock and water (i.e. high versus low density rock, mountains versus valleys), and on the earth’s rotation. Rock density varies considerably from one place to another. Pumice floats. Basalt (a dark grey volcanic rock) is denser than granite because basalt contains a lot of iron-bearing minerals. Likewise, ice is less dense than water (icebergs, the cubes in your G&T). Earth scientists now have pretty good maps that show the regional and global variations of rock types and gravity.
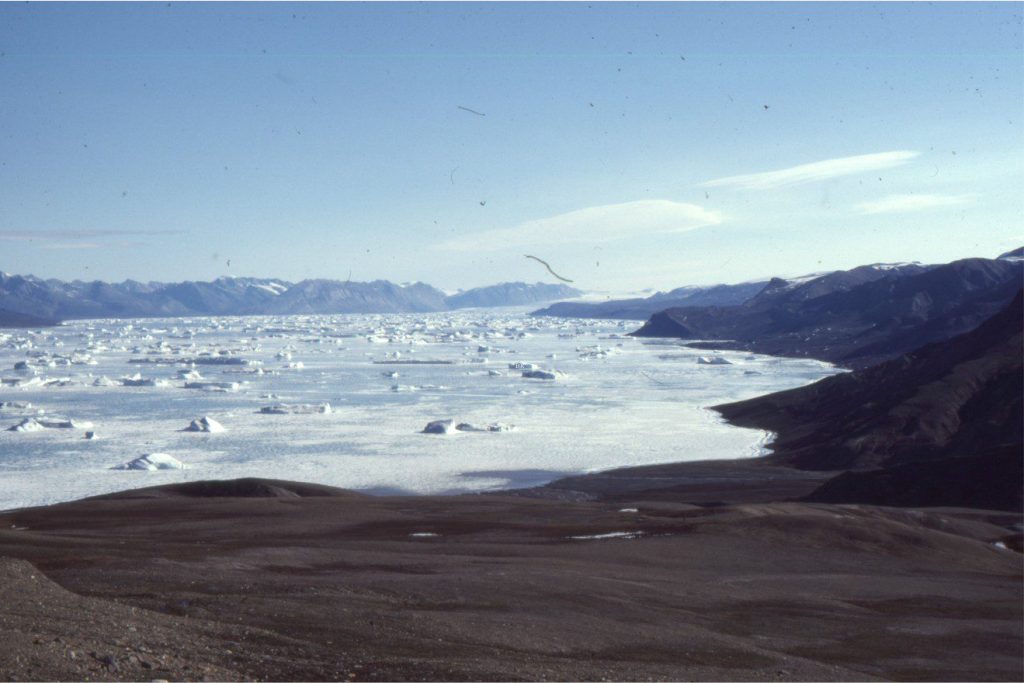
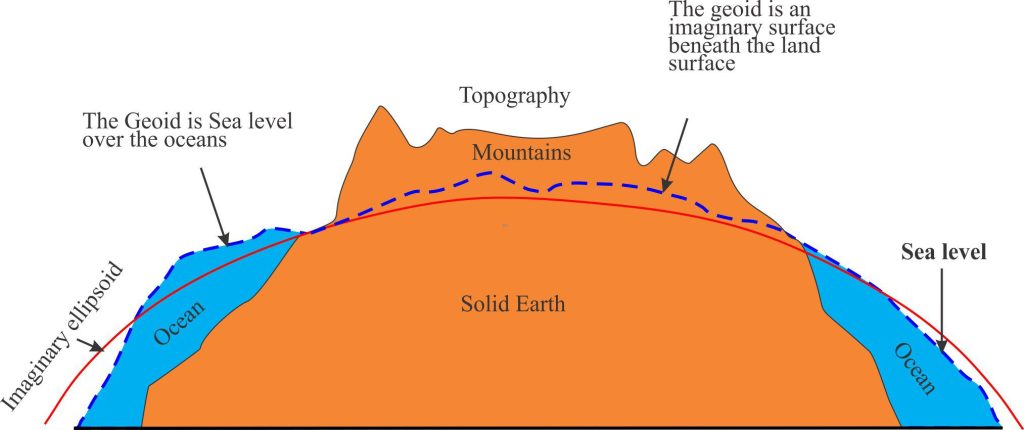
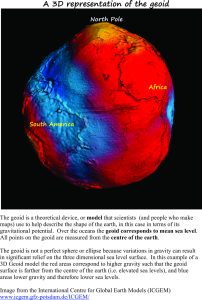
Water masses like the oceans respond to changes in gravity. A region that has strong gravity forces will tend to pull water towards it. Therefore, as gravity varies across the globe, so too does sea level. In fact the maximum difference in mean sea level across the oceans is more than 100m! This difference in height is over and above any differences in tidal range and other brief events like storm surges from hurricanes and tropical cyclones.
In other words, if you were to create a 3D model of sea level it would look like a pretty lumpy globe. The elevated regions of the lumpy surface correspond to high gravity (or gravity potential) and the lower regions (like valleys) to low gravity potential. For our discussion, the important point is that the 3D map of mean sea level has pronounced humps and hollows.
When an ice-sheet develops, like Antarctica (more than 4km thick in places) or Greenland (up to 3.2km thick), the additional thickness of ice (over the rocky landmass) changes the gravity signal – the total gravitational force increases which results in the adjacent water mass being pulled towards it. Sea levels adjacent to the ice-sheet will tend to be higher than those farther afield. The opposite effect occurs when the ice-sheet melts, adding to the total ocean volume; gravity is reduced enough to result in a lowering of sea level around the landmass. A Harvard Magazine interview with geophysicist Professor Jerry Mitrovica further explains how this phenomenon can have far reaching implications for sea level rise in places far removed from melting ice-sheets. For example, Mitrovica predicts that if only the Greenland ice-sheet were to melt, sea level around the Scottish coast would probably fall; those around much of Australia would probably rise. But if Antarctica melted and Greenland did not, then a different picture of
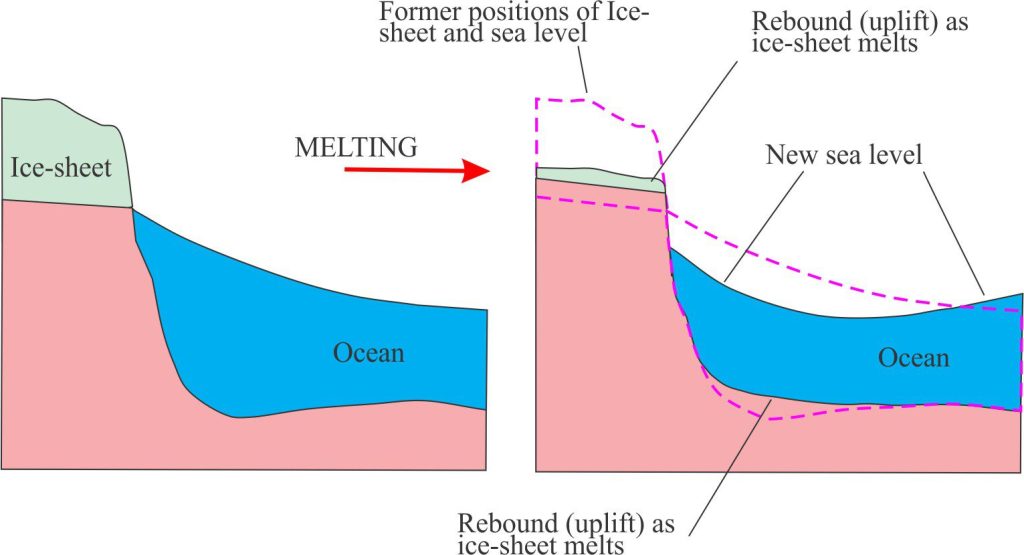
sea level would emerge. So not only do rising sea levels depend on ice-sheets melting, they also depend on which ice-sheet melts first. The two processes (changing gravity and changing ocean volume) are acting at the same time. These implications are particularly pertinent to inundation-risk maps of coastlines.
To complicate matters further…
We normally think of rocks as being hard and brittle – hit them with a hammer and sparks fly. The earth’s crust is made up of many different kinds of rock (and sediment plus water). However, on a regional scale (like the scale of whole continents) the crust also can act ‘elastically’. If a large load is placed on the earth’s surface (like 4 km of ice) the surface is depressed beneath the load. This is exactly what has occurred beneath Antarctica and Greenland, and has also happened with ice-sheets that have come and gone in the past. An easy way to think of this to take a foam-filled pillow and place a heavy book or rock on top. The top surface is depressed and the sides spread out a bit. Take the load off and the pillow bounces back (you could also do this with a balloon). This also happens when an ice-sheet melts. Not only does the landmass (crust) beneath the ice-sheet rebound, but so too does the crust beyond the original limits of the ice sheet. Thus, sea level relative to the land surface appears to become lower resulting in the shoreline moving seawards. This Rebound of the earth’s surface (the scientific term is Isostatic Rebound) also has an effect on gravity because the rock mass and ice/water are being redistributed.
An example from the last glaciation nicely illustrates these points. During the last glaciation (beginning 110,000 years ago) most of Canada and parts of northern USA were covered by the Laurentide Ice Sheet.
The ice-sheet began to melt about 19000 years ago and finally left the Hudson Bay region about 8000 to 9000 years ago. The land mass in the Hudson Bay area began to rise, initially at an incredible 9-10m per 100 years, slowing to the present rate of about 1m per 100 years. The
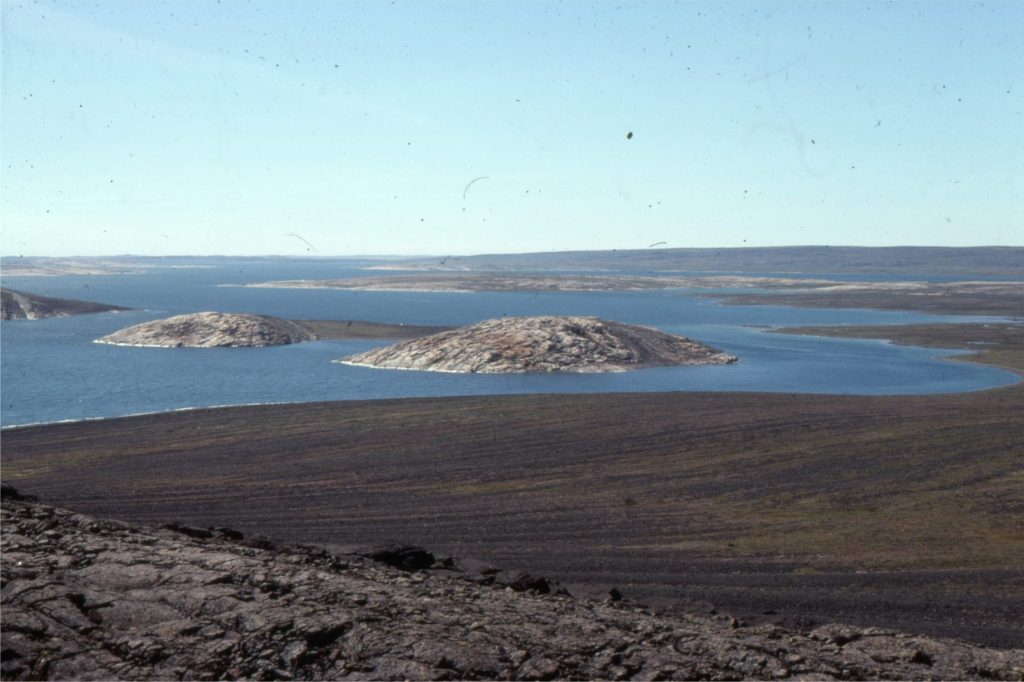
Belcher Islands in eastern Hudson Bay contain some fantastic raised beaches, like a flight of stairs, that were deposited as the island landmass rebounded rapidly. Several years ago I spent two summers on the islands (about 5 months in all) doing research for my PhD (on the Precambrian sedimentary rocks). Walking over the islands I could not help but be intrigued by the abundant evidence of the past glaciation and subsequent uplift of the islands. The local Inuit elders could remember certain harbour entrances that they could take their boats through decades earlier, that now one can walk across. The changes are palpable and are taking place within lifetimes.
Water expands when it is warmed (the Steric effect)
Again, the physics behind this phenomenon are well known. Water expands as it is warmed. Expansion of water increases its volume, that in turn contributes to rising sea levels. However, the oceans don’t expand uniformly; ocean water masses are commonly layered according to temperature, and deeper waters will certainly take longer than surface waters to heat up. One of the complications in this process occurs when icecaps melt; cold water is added to the oceans such that there may be no expansion or expansion is delayed. So not all the ocean water masses will expand at the same rate (remember that the maximum density of water is at about 4oC). Therefore, the rate at which ocean expansion takes place will vary not only geographically, but also with depth.
What to make of all this?
- Sea level is not uniform on a global scale. A 3D model of the earth at sea level would contain significant humps and hollows where relief on the surface may be greater than 100m.
- Rising sea levels, that are a pretty important outcome of climate change (with obvious social and geopolitical implications), will not rise uniformly everywhere. In some places sea level may even fall.
- Rates of sea level change along any particular coast will also depend on which ice-sheet collapses first.
- Thermal expansion of water will not be uniform, and may even be delayed adjacent to the ice-sheets themselves.
- As the ice-sheets melt, the land beneath will rebound – probably at an alarming rate.
- The potential risks from sea level rise along any particular stretch of coast cannot be assumed to be the same as every other stretch of coast.
- Society needs to prepare for changing sea levels. However, if we are to avoid costly mistakes then governments, planners, and those who assess risk need to involve the kind of scientific expertise that is capable of analysing what is likely to happen, rather than basing decisions on incorrect assumptions.
Here’s a post on How to read a sea level curve




1 thought on “Sea-Level Change; Busting a Few Myths”
Pingback: The sea level equation | Geological Digressions