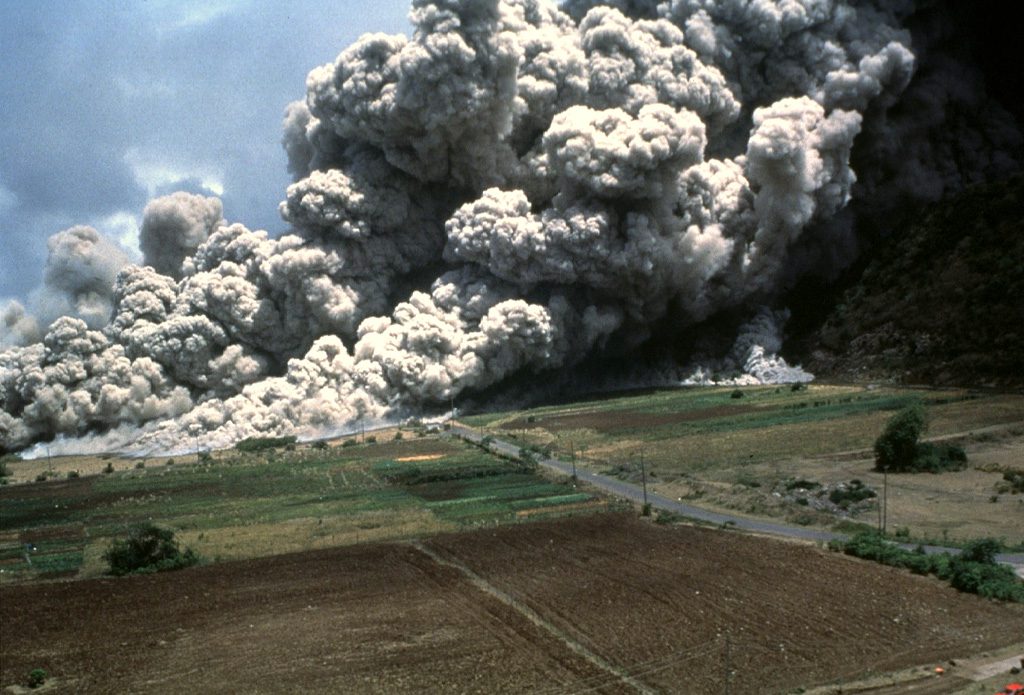
Pyroclastic surges, are dilute, ground-hugging turbulent flows of hot, juvenile volcanic particles and a fluid phase of superheated steam and air.
Some historical context
One of the more useful bits of science to come out of the 1940s-50s atmospheric nuclear weapons tests at Bikini Atoll (ie. useful to humanity in general) were observations of surging, ground-hugging flows resulting from shock waves and collapsing particle – water vapour columns. An early description by Young (quoted in Wohletz,1998 – the following historical notes are mostly from his descriptions) notes that the flow “… was a dense toroidal cloud which emerged from the base of the cylindrical column of spray that was formed by the explosion. As the column settled back, it apparently fed material into the base surge, which spread rapidly along the surface of the lagoon”. Initial flow velocities were about 33 m/second (118 km/hr). Flow dynamics within the surge were dominated by turbulence such that its upper boundary mixed with air; the nose of the flow was characterised by “bulges and pockets”. Later ground-based tests revealed thin deposits containing dune-like bedforms. Flow deceleration was primarily a function of gravity, atmospheric drag, and particle dilution through the top of the plume. The term given to these flows was base surge.
Richard V. Fisher was one of the first geologists to observe base-surges derived from nuclear detonation and successfully applied the analogue to ground-hugging flows derived from explosive volcanic eruptions; specifically, the Taal volcano (Luzon, Philippines) and Capelinhos (Faial, Azores) eruptions in 1965 and 1957 respectively (e.g., Fisher and Waters, 1970). Coincidentally, J.G. Moore (1967) observed some dune-like bedforms, like those formed during nuclear tests, in deposits from the Taal event and interpreted them as base surge. He also estimated maximum flow velocities > 50 m/s (180 km/hr), and flow temperatures of 100oC.
Thus, the groundwork for our current understanding of pyroclastic surges was set in motion.
Common traits of pyroclastic surges
Dilute pyroclastic density currents (PDCs), including those referred to as surges or base surges, are turbulent flows of hot, juvenile volcanic particles and a fluid phase consisting mostly of superheated steam and air. Surging PDCs are initiated in several ways (Sulpizio et al., 2014; PDF available):
- By column collapse of explosive eruptions, particularly hydromagmatic or phreatic maar eruptions.
- They may decouple from more concentrated PDCs such as ignimbrites, at changes in slope or channel overbank flow.
- They can also evolve by decoupling from block and ash flows.
- Initiate directly from magmatic dome collapse.
- From directed, lateral blasts.
Pyroclastic surges have velocities ranging from 10s to several 100 m/s and extend many kilometres from the volcanic vent. Surge deposits tend to be thinner and finer grained than more concentrated PDCs. Stratification is common. The term “bulges-and-pockets” used to describe the nose of detonation-derived base surges has been replaced with the term lobe-and-cleft.
Flow mechanisms
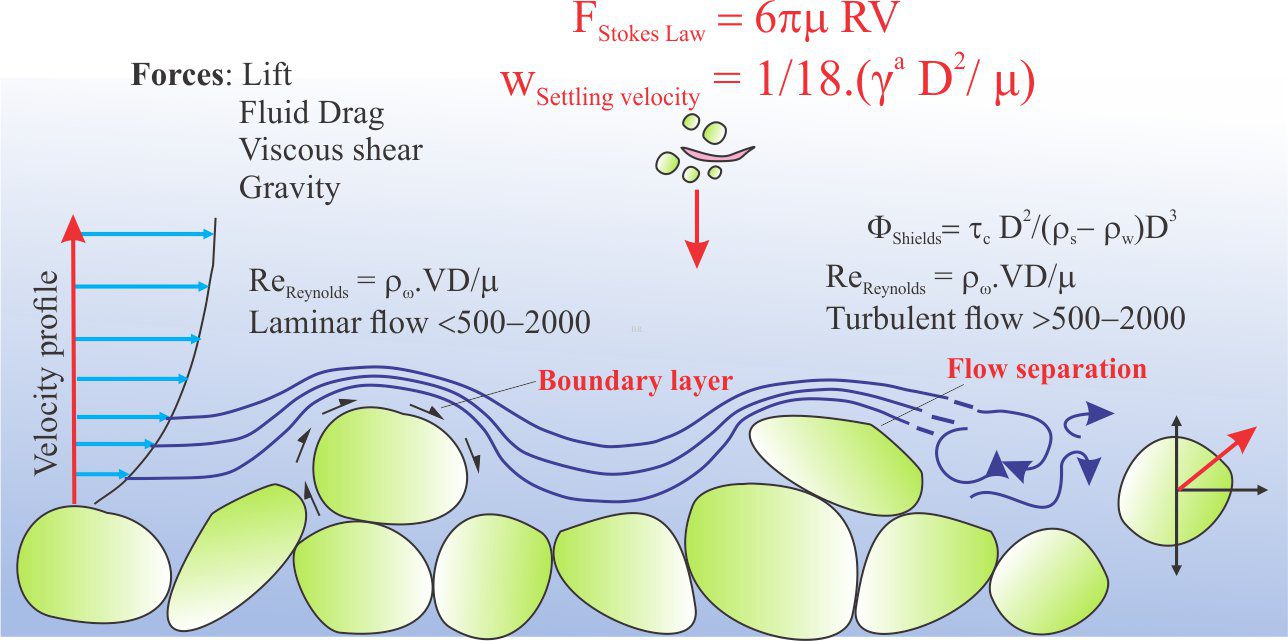
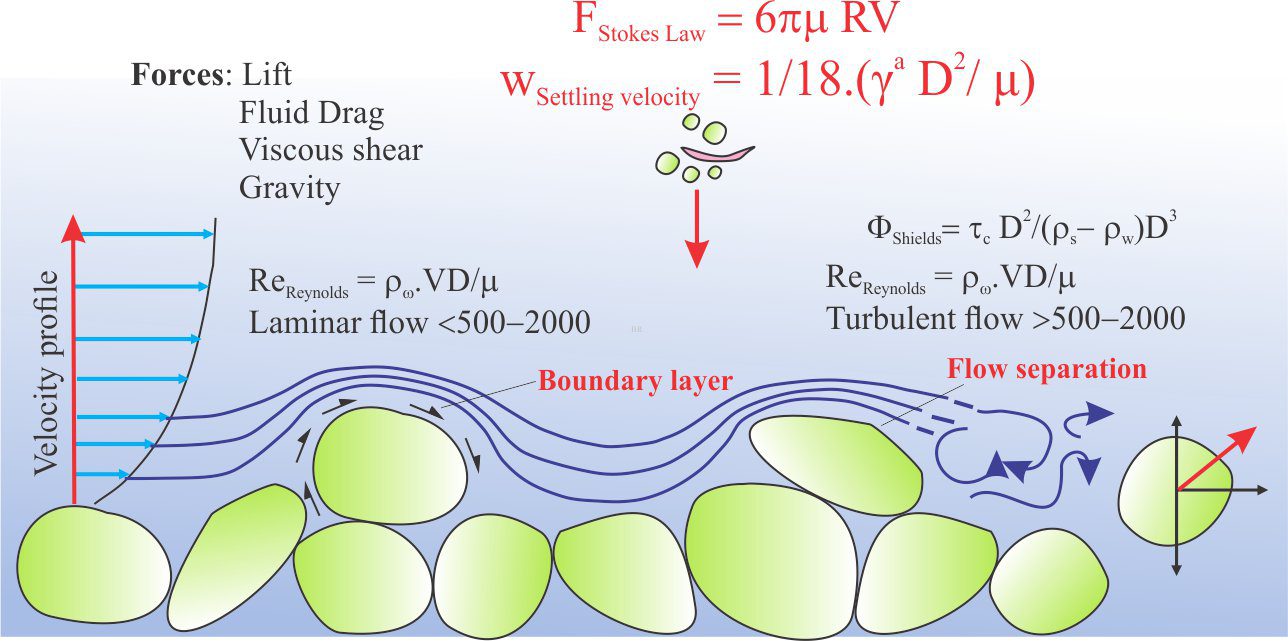
Deposition from pyroclastic surges is fundamentally different to other PDCs. The primary mechanism for flow maintenance in concentrated PDCs is grain-to-grain collisions, although regions of turbulence may develop in the distal or upper parts of flows that have been diluted by elutriation or deposition. In contrast, pyroclastic surges are supported by the turbulent mixing of particles and vapour (Wilson and Houghton, 2000; Pyroclastic transport and deposition); Dufek et al., 2016). Turbulence begins with flow initiation and is maintained by shear between the top of the flow and overlying plume and air, and shear along the substrate at the base of the flow. An important consequence of this mechanism is that deposition from pyroclastic surges will also be fundamentally different to that derived from concentrated PDCs.
An important paper recently published by Brosch et al., (2021, Open Access) helps elucidate the structure of these turbulent eddies. Their observations of monitored experimental flows combined with direct measurements of the Whakaari eruption in 2019 (White Island, east coast New Zealand) that killed 22 people, enabled them to describe the turbulent structure and pressure variations within pyroclastic surges. Key findings include:
- Turbulent eddies may be as large as the PDC is deep.
- Maximum dynamic pressures are carried within the turbulent eddies and surface gravity waves – it is these pressures that maintain momentum and cause physical damage.
- The turbulent eddies and gravity waves propagate downflow.
- Propagation of eddies appears to show a degree of periodicity. It is likely that surges at the flow head are linked to these periodic eddies.
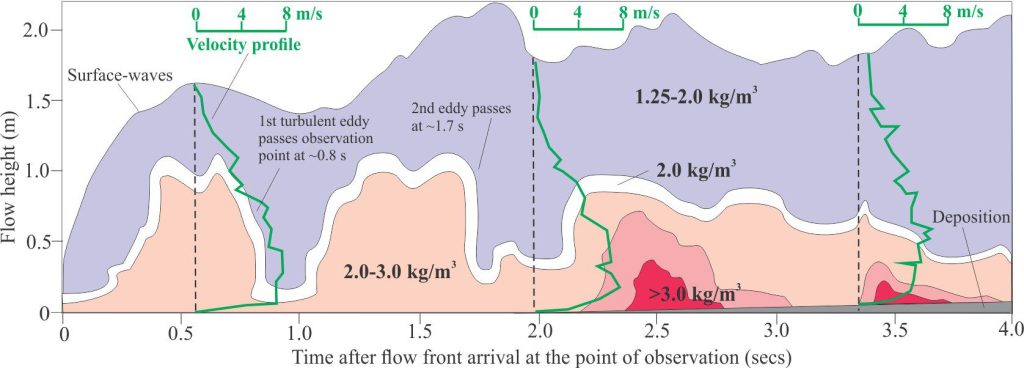
Significant density fluctuations at about 1 and 2 seconds indicate the passage of two turbulent eddies past the observation point. The eddies correspond approximately with the passage of two surface waves. Brosch at al., calculate the periodicity here at about 800 milliseconds. The eddies also correspond to pressure maxima.
Maximum velocities occur in the lower half of the flow. The abrupt decrease in velocities at the flow base is probably caused by bed roughness and other frictional losses immediately above the developing traction carpet. Waning velocity and density at 4 s due to sedimentation and elutriation of fine particles to the overlying plume.
Deposition from pyroclastic surges
Turbulence is partly dependent on the generation of shear along the flow base – shear that arises from bed roughness plus frictional and inertial forces. Flow velocity will be reduced along this shear boundary and at a certain point solid particles will begin to fall from the turbulent suspension forming a traction carpet (e.g., Branney and Kokelaar, 2002). Shear at the traction carpet – flow interface results in stratification, including dune- or ripple-like bedforms. The dunes are three-dimensional constructions – they range in length (measured from crest to crest) from a few centimetres to many metres (analogous to bedforms generated by explosive devices); bedform amplitudes are usually measured in centimetres to 10s of centimetres. Dune crests may be straight and transverse to flow directions, or arcuate analogous to open flow barchan and lunate ripples (Douillet et al., 2013; Open access). Internally, the bedforms contain cross stratification (crossbedding) indicating that they form by accretion of grains transported by a combination of bedload transport, saltation, and fallout from suspension in the overlying flow. The relative contribution of each mechanism may change depending on fluctuating conditions within the flow.
Common bedforms include (Douillet, 2021; open access):
- Parallel and low-angle stratification.
- Low amplitude ripple- and dune-like bedforms that preserve both lee and stoss slopes. Stoss-side truncations and drapes may also form.
- Successive ripple or dune trains that climb over the preceding bedforms, in a manner analogous to climbing ripples in some fluvial, tidal, and submarine channels, where deposition is a combination of bedload transport and rapid fallout from suspension.
- Steep-sided truncation surfaces draped by backset laminae (i.e., laminae that accrete upstream).
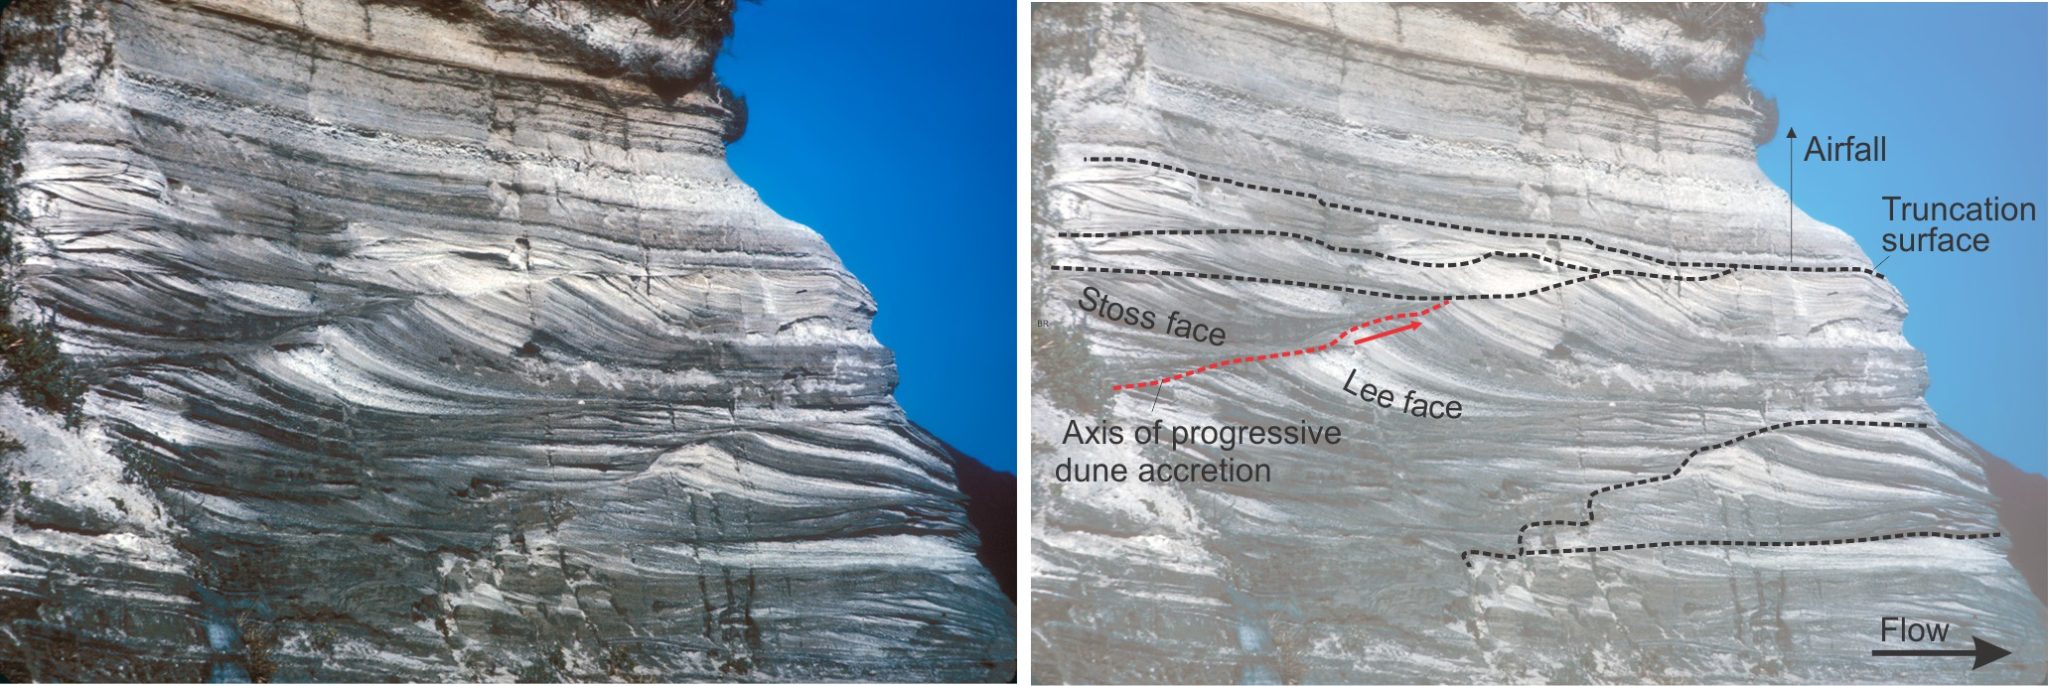
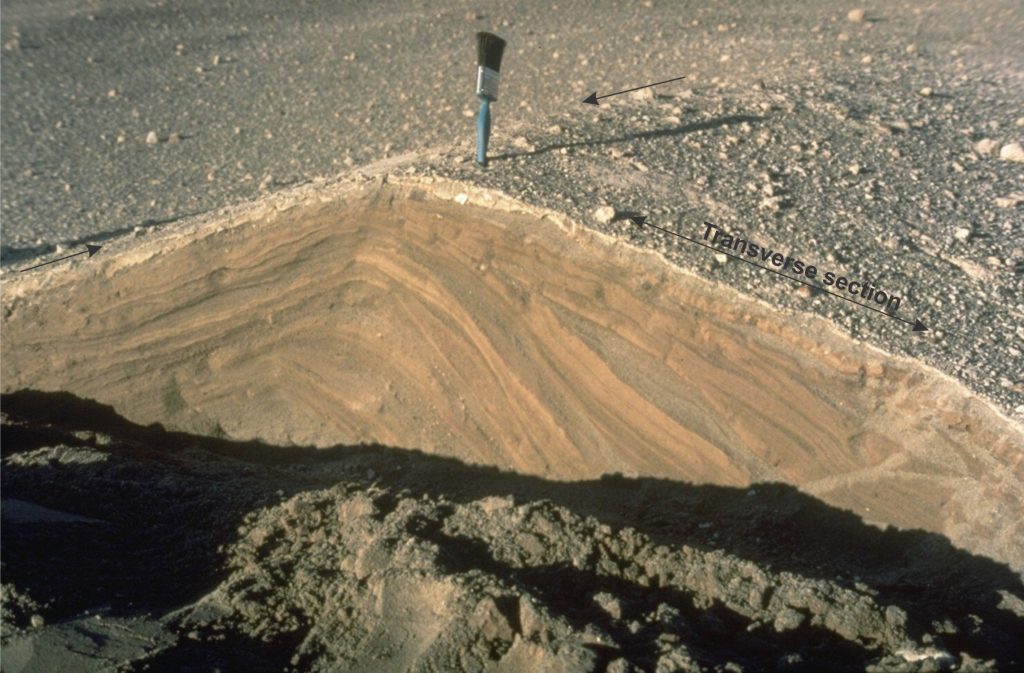
A common feature of these bedforms is the preservation of both stoss and lee faces, in contrast to the kinds of bedforms normally associated with fluvial and marine flows where cross stratification is nearly always that which accumulates on lee slopes. The accretion of laminae that gives rise to the surge bedforms may be:
- Symmetrical (either side of the bedform crest), or
- Accretion may be dominant in the down-flow direction – these are called progressive laminae that prograde and aggrade down-flow, or
- Accretion may be dominant in the up-flow direction (regressive laminae); i.e. against the primary current.
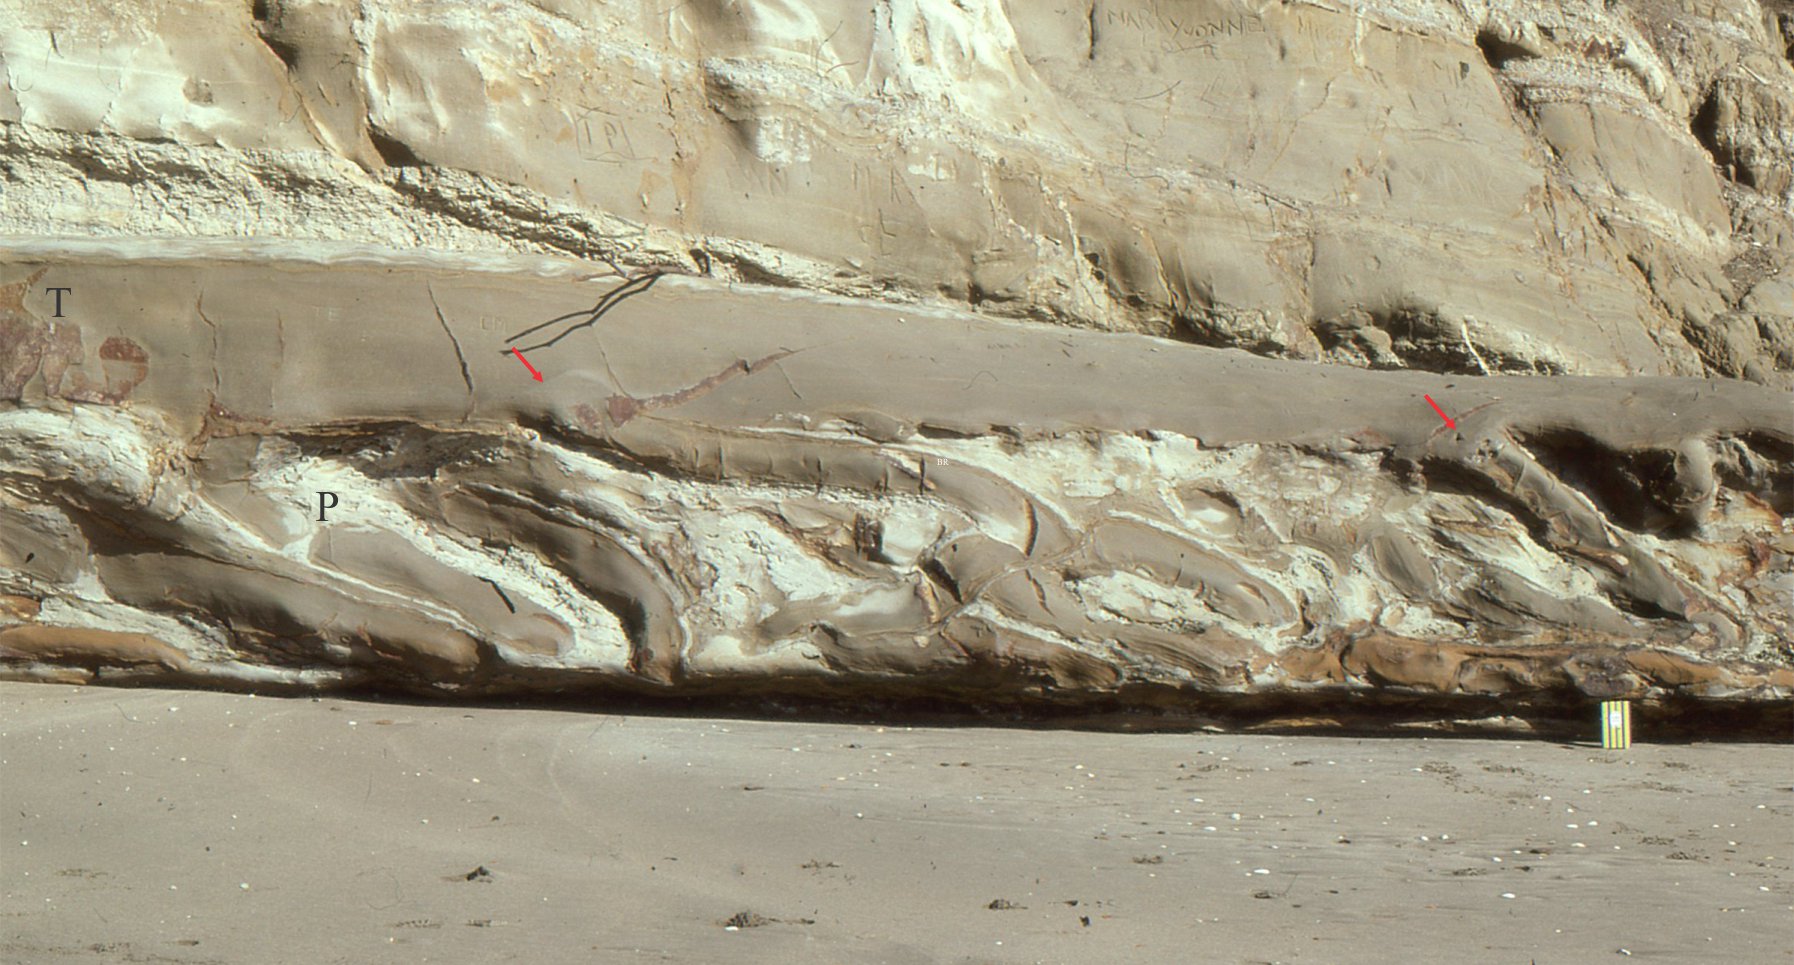
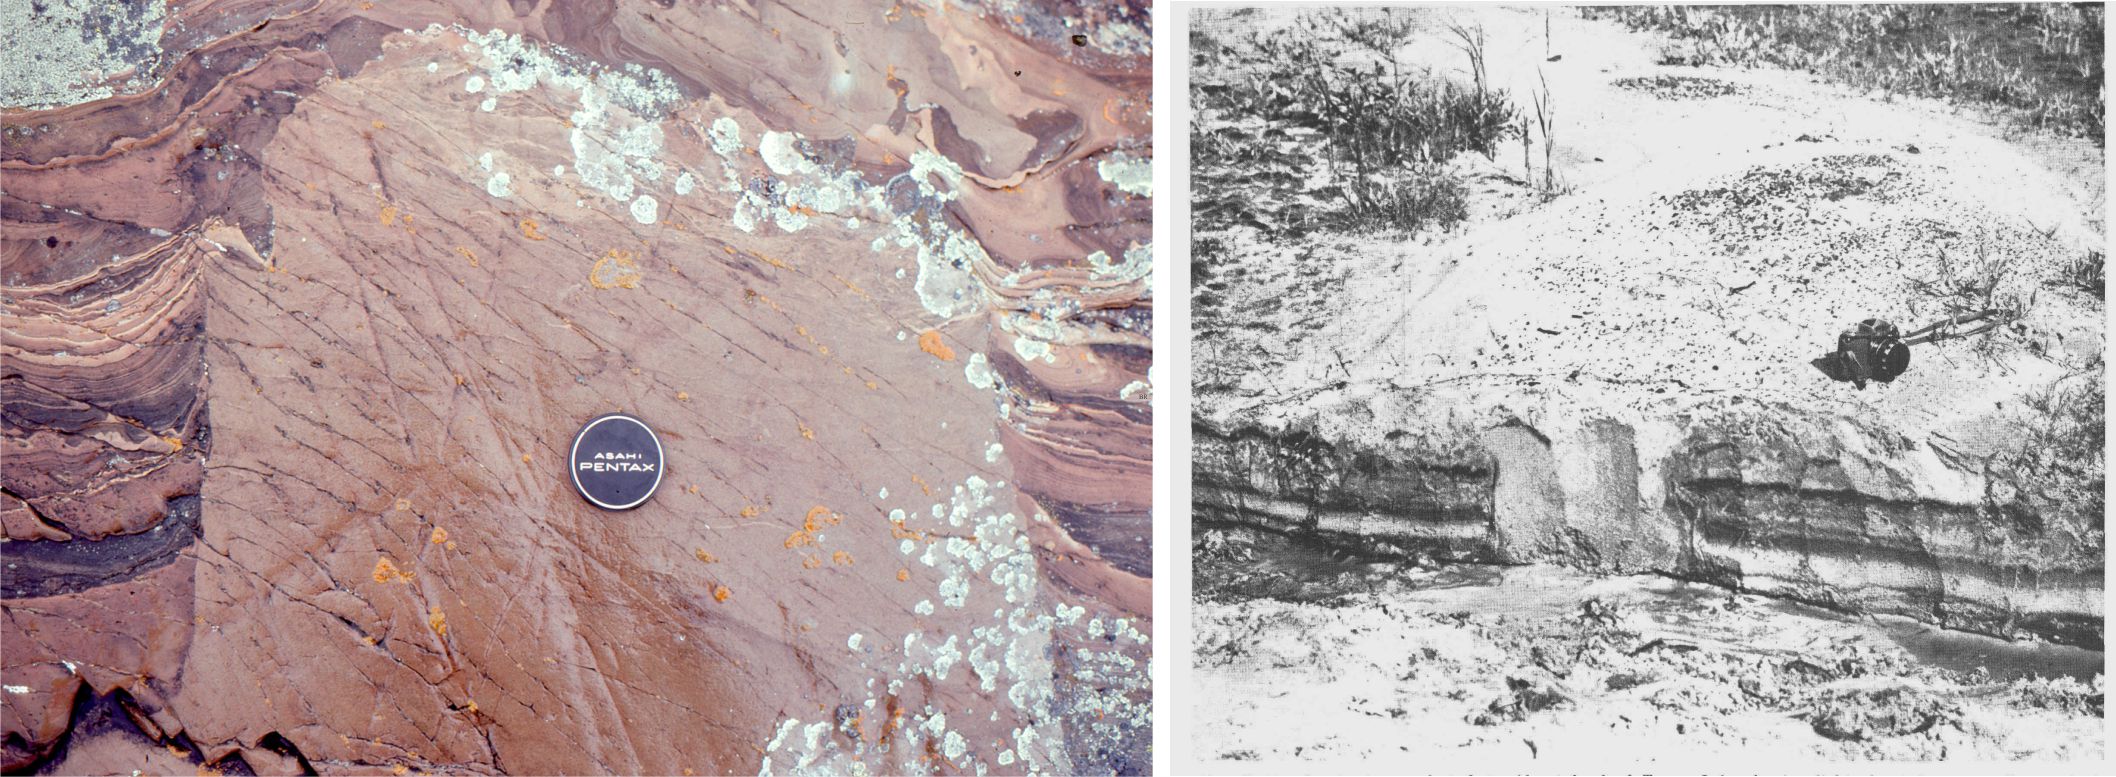
Some of these depositional patterns are shown in the outcrop images below.


Do these bedforms represent tranquil or supercritical flow?
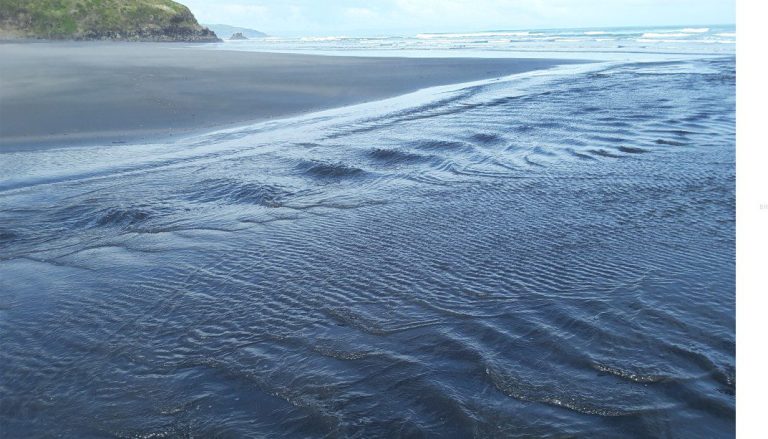
The terms tranquil (or subcritical), critical and supercritical are used to describe the relationship between surface waves and bedforms in open flow – thanks to William Froude. Open flow in fluvial and marine environments is rarely more than a few metres/s, and usually < 2-3 m/s. At the top end of this velocity range, flow becomes critical where surface waves (also called standing waves) are in phase with bedforms (antidunes) and is supercritical when the surface waves move upstream or break upstream (chutes) – this is also referred to as upper flow regime. At lower flow speeds (tranquil flow) surface waves move downstream and are out of phase with bedforms (lower flow regime ripples and subaqueous dunes). The preservation of antidunes is rare in normal open flow conditions because the bedforms tend to be washed out during waning flow.
In contrast, pyroclastic surge velocities are 1 to 2 orders of magnitude greater than normal fluvial or marine flows. And although the PDC fluid medium is fundamentally different, critical to supercritical conditions are likely to persist at these velocities. The geometry of the resulting bedforms supports this interpretation:
- The formation of antidunes commonly involves deposition on both stoss and lee faces that are approximately symmetrical about the bedform crest.
- Stoss and lee face inclinations are relatively low compared with the angle-of-repose crossbed foresets (lee face) of tranquil flow dunes and ripples.
- Upstream accretion of bedform laminae on the stoss face will take place if surface waves move upstream during supercritical flow.
- Steep-sided truncation surfaces may represent erosion during chute and pool conditions (where standing waves break) or even a brief excursion to tranquil flow via a hydraulic jump. Draping of truncation surfaces by stoss and lee face laminae indicate a return to critical or supercritical conditions.
The maintenance of critical – supercritical flow for the duration of these pyroclastic surge events is recorded in the depositional record that contains multiple, vertically stacked, laterally accreting, and truncated bedforms. Each surge event is relatively short lived, (measured in minutes) and deposition is rapid. Bedform preservation potential is high because any excursions to tranquil flow are also short lived.
Related posts
Accretionary aggregates and accretionary lapilli
Ignimbrites in outcrop and thin section
Volcanics in outcrop: Pyroclastic density currents
Volcanics in outcrop: Secondary volcaniclastics
Volcanics in outcrop: Lava flows
Volcanics in outcrop: Pyroclastic fall deposits
Fluid flow: Froude and Reynolds numbers
