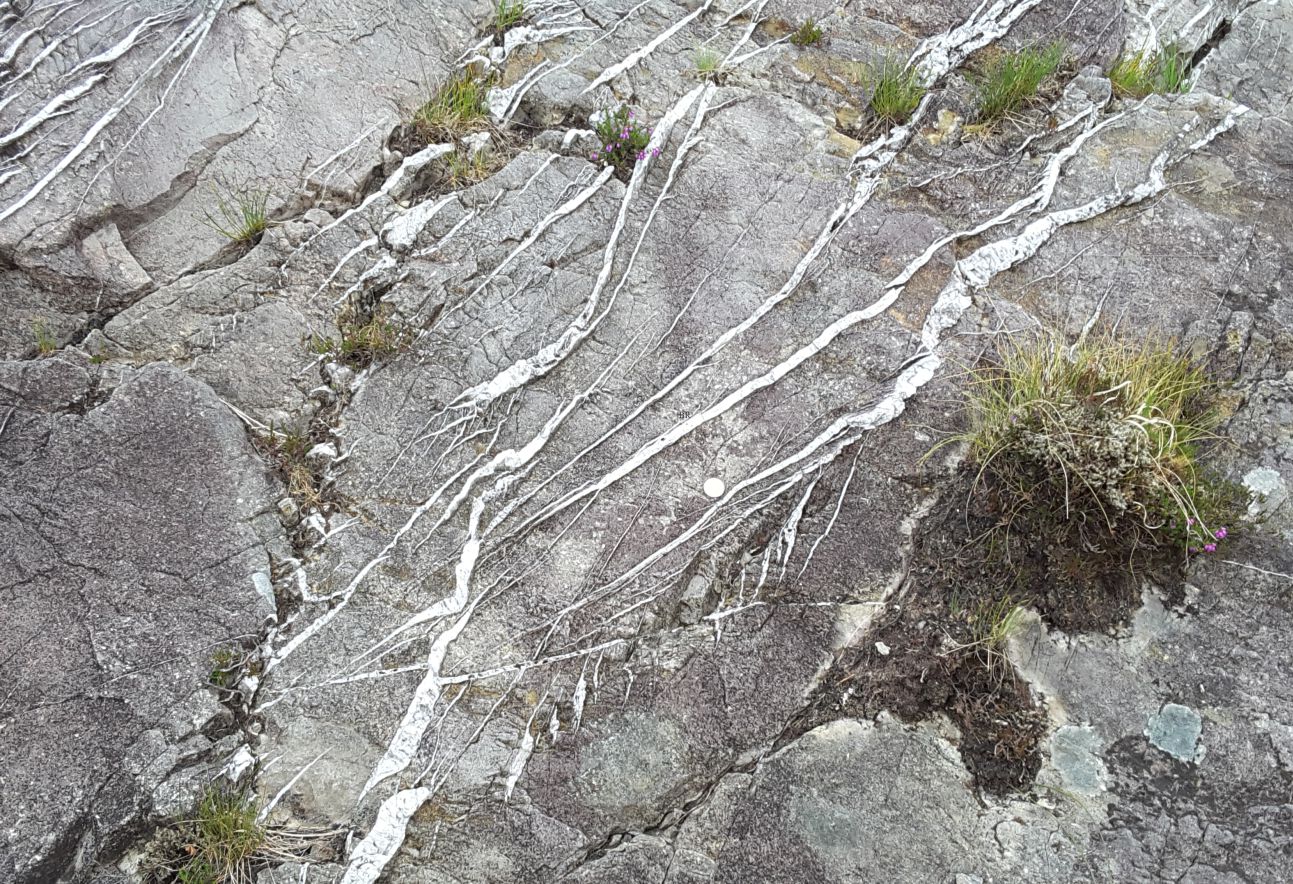
Brittle deformation and Mohr-Coulomb failure
Deformation of Earth materials takes place predominantly within two rheological domains: brittle and ductile. Deformation close to the Earth’s surface is dominated by brittle failure (faults, fractures, and joints); ductile behaviour of rock become increasingly important deeper in the crust and lithosphere mantle – exceptions include the deformation of ice and salt at shallow depths. Ductile deformation depends on differential stress, material viscosity, and time, where the latter is generally couched in terms of strain rate. Brittle failure also depends on strain rate, but at the opposite end of the scale; it is also a function of rock strength.
Rock strength is a measure of the stress required to produce failure. It has the units and dimensions of stress, commonly expressed as megapascals (ML-1T-2). Rock strength is defined for tensile and compressional conditions – joints are mostly tensile structures whereas faults and fractures involve components of shear with dip-slip, strike-slip or oblique-slip movement along planes of failure. In general, compressive strength exceeds tensile strength within the crust.
Measurement of rock strength
The strength of any material can only be determined by experiment. For hard rock the most common tests are the uniaxial and triaxial compression tests. Triaxial tests can also be used for unconsolidated soil and sediment, but other methods like cone penetrometry are probably more useful for determining resistance to stress.
Uniaxial and triaxial tests subject a small cylinder of rock to axial normal stress (σ1) using a piston at one end of the cylinder. In uniaxial tests the rock cylinder is unconfined such that σ2 = σ3 = 0). For triaxial tests, rock cylinders are enclosed in a jacket of rubber or metal that is pressurized, commonly by oil or some other fluid that surrounds the jacketed sample; in this case σ2 = σ3 > 0. Tests with this apparatus will usually increase the confining pressure incrementally. The piston pressure value at the point of failure corresponds to the material strength. Typical triaxial stress-strain curves are shown below.
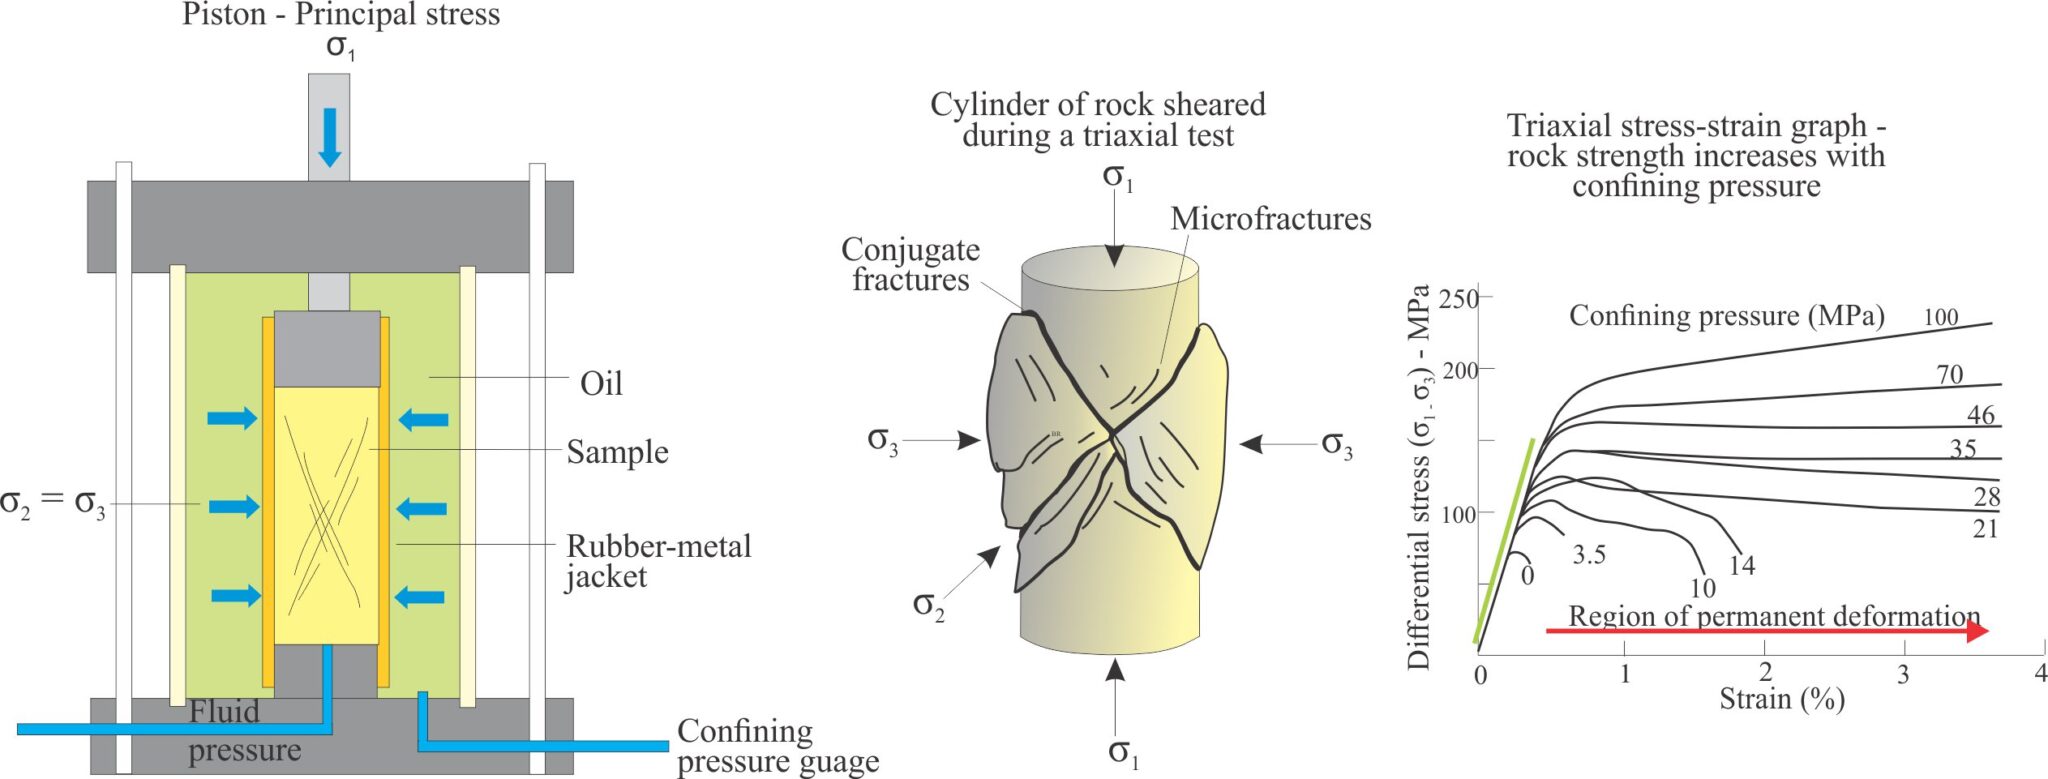
Failure at very low confining pressures commonly produces fractures that parallel the rock cylinder. At higher confining pressures conjugate fractures form where the conjugate set is approximately bisected by the maximum principal normal stress σ1. Theoretically the two fracture planes should form at angles where the shear stress is a maximum, in other words at 45o to σ1. The fracture angle (θ) is measured from σ1 to the normal to the fracture plane. The reason for this is that the stress acting on the plane can be resolved into a normal stress component at right angles to the plane, and a component parallel to the plane which is the shear stress. Based on experiment, (θ) measured in this way tends to be slightly larger than 45o (which means the fractures are aligned slightly less than 45o either side of σ1). Furthermore, it has been determined experimentally that the normal stress (piston pressure) required for sample failure increases with increasing confining pressure, but the fracture angle for a particular material (θ) remains relatively constant.
Coulomb’s statement of material failure
The experimentation and theory that established the principles of rock strength and criteria of failure are commonly attributed to Charles Augustin Coulomb (1736-1806) although his initial research drew on the work of two illustrious predecessors – Leonardo da Vinci (1452-1519) and Guillaume Amonton (1663 –1705). Both conducted experiments on friction; of significance to Coulomb’s later work was their conclusion that frictional forces are proportional to the normal forces acting on a plane.
Amonton in 1699, expressed this relationship something like:
Frictional force/ σN = Tan φ
where σN is the normal force, φ is the internal friction angle, and Tan φ is variously called the friction factor, or friction coefficient, commonly written as γ. Tan φ is dimensionless. The internal friction angle is defined as the angle between the normal stress and resultant stress at the point of failure. The ‘internal’ part of the name refers to friction forces within a material – forces that resist deformation, rather than friction on a surface.
[Note the difference between the internal friction angle φ, and the angle of fracture θ that references an actual, observable fracture plane – they are not the same measure.]
Coulomb recognized the importance of friction as a control on material failure. However, he concluded that the natural strength, or cohesion of rock, sediment, and soil also played a critical role (Coulomb, 1773). His mathematical statement expands Amonton’s equation such that the shear stress (τ) at the point of material failure requires a cohesive strength term and a friction term, thus:
τ = C0 + Tanφ σN or
τ = C0 + σN γ
where τ is the shear stress at the point of failure and C0 is the material cohesive strength. This is the iconic Coulomb criterion for material failure.
A useful way to visualize the internal friction angle (φ) is to conduct a simple experiment demonstrating the angle of repose for a pile of dry, well-sorted sand; the actual value is about 34o. If the slope increases it becomes gravitationally unstable and grains will slide or tumble downslope until the repose angle is re-established – in other words, the granular material shears – the repose angle represents the condition of dry sand peak-strength at the point of failure. This basically is the model applied to failure of harder rock where internal shear is caused by differential stresses.
Plotting Coulomb’s criterion for failure
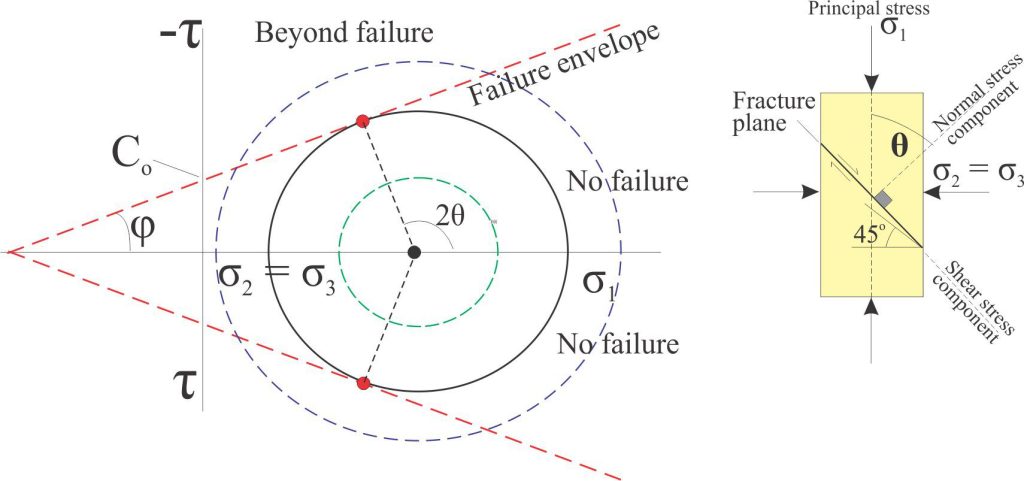
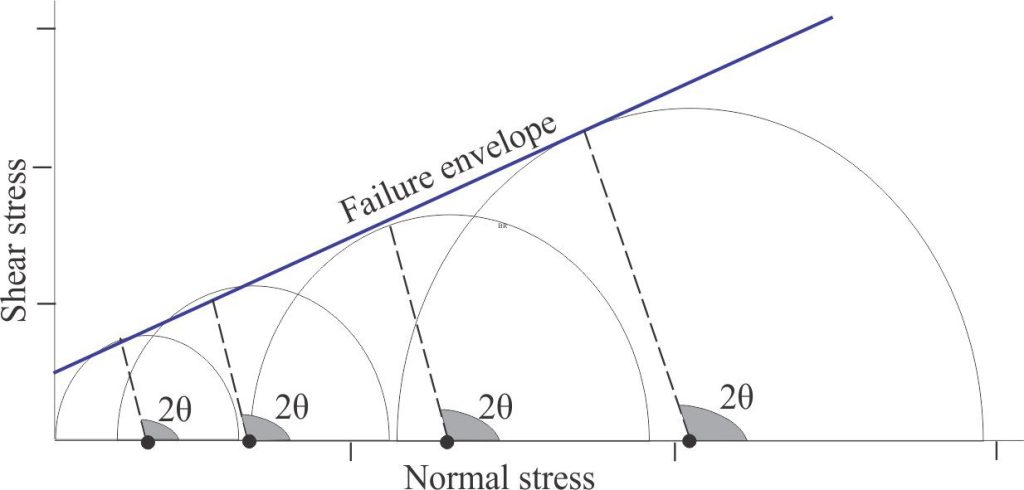
Coulomb’s statement τ = C0 + Tanφ σN is the equation of a straight line for a graphical plot of shear stress against normal stress – also called the failure envelope or Mohr-Coulomb envelope. The slope of the line gives the value of (φ); the intercept on the shear stress axis (τ) is C0.
The two axes in the plot (shear stress τ and normal stress σ) are the same used to construct Mohr circles. Construction of the Mohr-Coulomb diagram for the failure conditions of a particular material makes use of experimental data obtained from the stress tests described above. The failure envelope makes a tangent to the Mohr circle at the point where the stress conditions for failure are represented (red dot in the diagram below). As noted previously, the orientation of the experimental fracture plane is designated θ – the angle measured from the normal to the fracture plane to σ1. On the Mohr circle this is plotted as 2θ. In a conjugate fracture set there will be two failure envelopes – one at or close to the maximum positive shear stress, and the other the minimum negative shear stress.
Constructing a Mohr-Coulomb envelope
The starting point is measurement of the principal stress (σ1) and confining pressures (σ2 = σ3) at the point of failure, and the experimentally derived fracture plane angle θ; the value of 2θ gives us the tangent to the Mohr circle. In practice, measurement of θ can be difficult because failure does not always occur along a single, coherent plane. To avoid this problem, it is common practice to perform several experiments on the same material and measure the principal stress (piston pressure) at different confining pressures. The rationale for this, as noted above, is that θ remains reasonably constant for different confining pressures. Mohr circles are constructed for each case and the line representing the best-fit tangent is drawn, giving us values of 2θ, φ, Co, and shear stress at each point of material failure.
The non-linear case
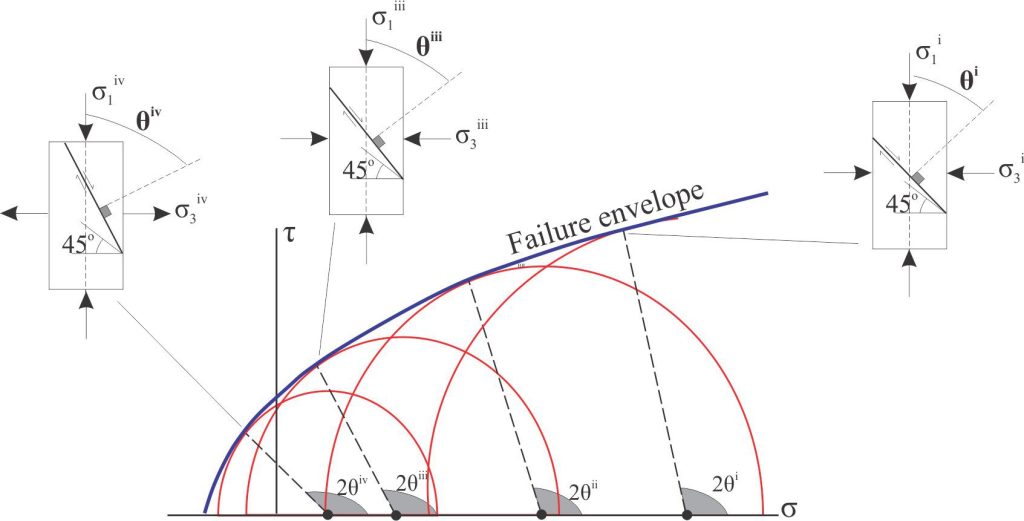
For many cases of brittle deformation, the straight-line failure envelope is a good approximation of the conditions leading to fracturing. However, for some materials the failure angle is not a linear function of confining pressure – the result is a parabolic curve in which 2θ and φ are not constant with decreasing confining pressures. This is manifested as fracture planes that steepen towards σ1 (i.e., the angle between σ1 and the fracture plane decreases) whereas 2θ increases.
Other posts in this series
Mohr circles and stress transformation
Analogue models of orogenic wedges
Solving the three-point problem
The Rule of Vs in geological mapping
Plotting a structural contour map
Stereographic projection – the basics
Stereographic projection of linear measurements
Stereographic projection – unfolding folds
Stereographic projection – poles to planes
Faults – some common terminology
Thrust faults: Some common terminology
Strike-slip faults: Some terminology
Using S and Z folds to decipher large-scale structures





3 thoughts on “Mohr-Coulomb failure criteria”
Hi dear sir, many thanks for these all examples whitch take hoght interest, so, wde need to know some programs applications to obtain this Plotting Coulomb’s criterion for failure. R_baouche@yahoo.fr Best Regards
You can send mpatlab sources or other programs. Many Thanks
There are several programs available online that you can look for