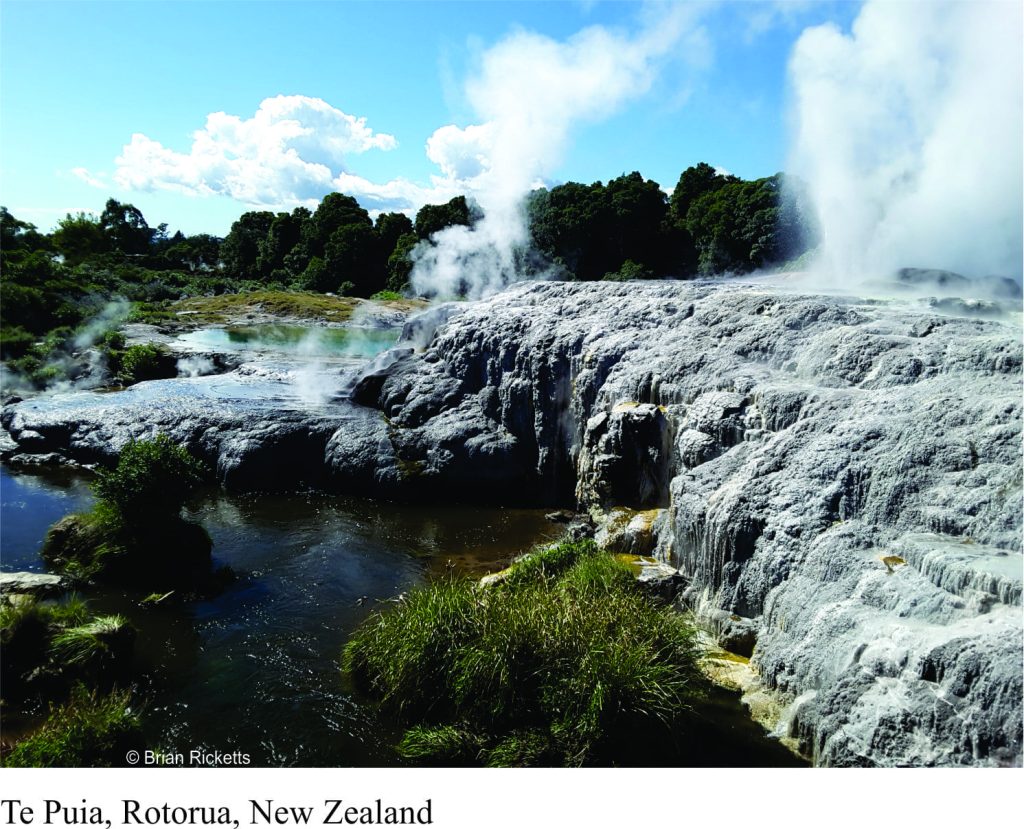
We don’t need to look far to see evidence that the interior of the earth is hot; geysers and geothermal power stations tap similar sources of heat and erupting volcanoes represent the end point for magmas journeying from the earth’s mantle. The same heat sources are responsible for many geological processes. Convection in the mantle is the primary driving force for plate tectonics. Piles of sedimentary strata, commonly 1000s of metres thick are transformed to rock as the fluids within heat up, promoting rock-forming chemical reactions. Internal heat also transforms organic matter; peat becomes coal and organic-rich shales produce hydrocarbons
Understanding how these piles of sedimentary rock (i.e. piles of rock within sedimentary basins) become warmer is an important part of geoscience. Advances in technology now provide us with several tools that allow us to unravel the thermal history (as it is commonly referred to) of these rocks. These tools utilize thermometers, or more correctly paleothermometers; paleothermometers are components of rocks (such as minerals, isotopes, fossils, fluids) that provide us with either a direct measure or proxies of paleotemperatures deep within the earth’s crust. Perhaps one of the better known examples is the conversion of plant matter to coal as temperature and burial depth increases. Armed with this data, we can improve our understanding of geological processes within the crust and make rational predictions about the likelihood of discovering renewable and non-renewable resources.
Earth’s heat pump
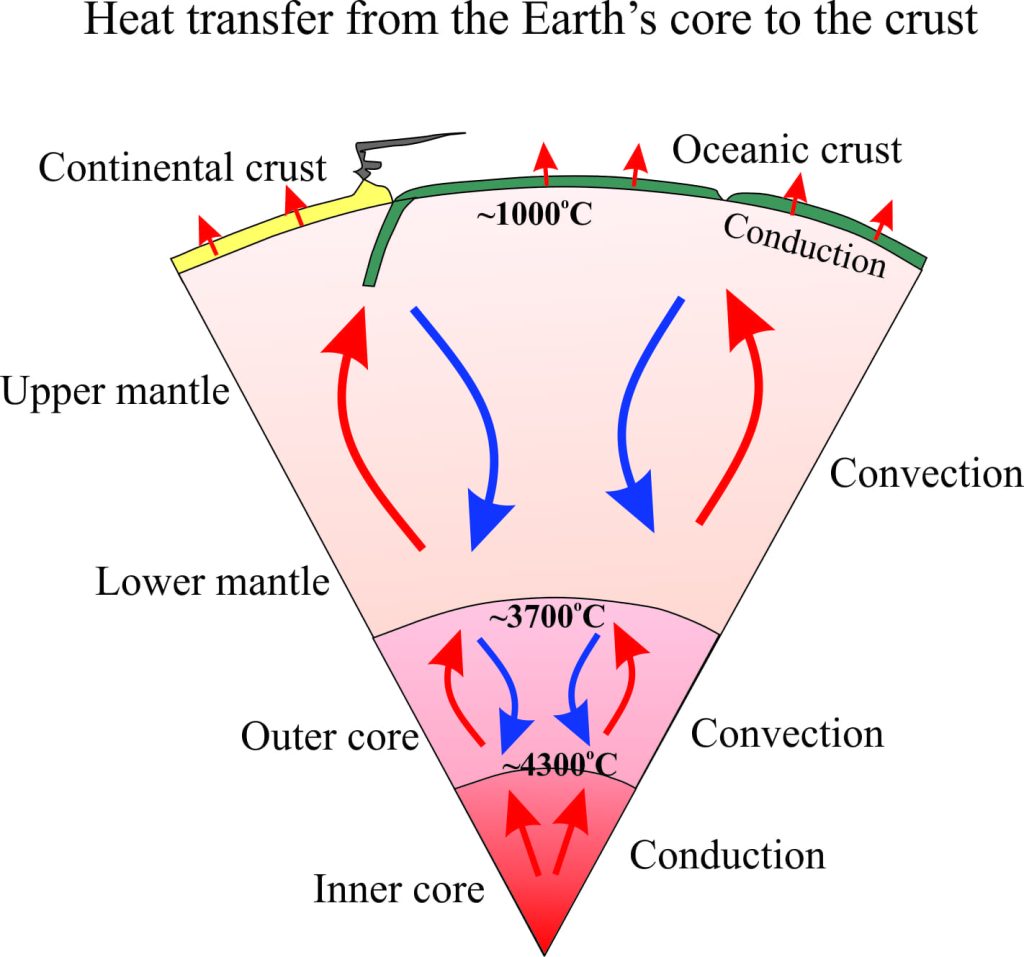
Earth’s interior has three main heat sources: primordial heat left over from the time, about 4.6 billion years ago when planetary accretion first took place; gravitational friction, and heat generated by decay of radioactive isotopes, mainly Uranium-238 and -235, Thorium-232 and Potassium-40.The adjacent diagram shows how heat is transferred from the interior iron-nickel core to the mantle and eventually the outer crust. Convective heat transfer from the lower mantle is the primary driving force for plate tectonics. Even though internal heat is important for geological processes, very little of it is actually delivered to the earth’s surface; the amount of heat that reaches the surface is approximately equivalent to a 100W light bulb over an area of about 200 square metres. Instead, most of the surface heat comes from solar radiation.
The increase in temperature with depth through the crust is well known from direct measurements in bore holes and deep mines. The measurements provide the data for estimating geothermal gradients for different regions of the earth’s crust; the global average for continents is about 25oC per kilometre of depth, but can vary from more than 50 oC/km in volcanic regions to less than 20 oC/km in cold oceanic trenches.
Thermal History; tools of the trade
Standard thermometers that are used to measure temperatures as they are now in deep mines and boreholes, cannot be used to measure temperatures in the geological past. Instead, we use two broad categories of rock material as surrogates to help unravel past temperatures and heating conditions in the crust: fossil organic matter, including actual fossils, and minerals. The most commonly used methods are illustrated in the cartoons below.
Organic matter that is buried changes in fairly predictable ways as depth, pressure, temperature and time increase. Plant material is compressed and gradually changes to coal, organic matter in mud rocks (shales) gradually breaks down to hydrocarbons (maturation), and certain fossils that contain organic compounds in their skeletal structure change colour.
Vitrinite reflectance – a benchmark method
Vitrinite is a component (a maceral) of coal. It forms by thermal alteration of plant tissues, especially cellulose, from the higher (vascular) plants. Broken surfaces of vitrinite are shiny and reflect light; the intensity of reflection increases as the rank of coal increases. The method involves taking samples of coal from rock outcrops, mines or boreholes; samples are cut, polished and immersed in oil. Light reflected from the polished surfaces is then measured. Mean and standard deviation values are usually calculated from a large number of measurements. Experience has shown that the Reflectance (designated Ro) can be related to the temperature of coal formation and coal rank (as shown in the diagram below). Ro values also correlate with the degree of organic maturation and hydrocarbon generation.
Colour alteration in fossils
Certain groups of microscopic fossils are known to change colour as depth of burial and temperature increase beneath thick piles of sediment. The two most common groups are fossil pollen and spores, and Conodonts (skeletal elements from eel-like chordates that became extinct about 200 million years ago. They are composed of apatite, a phosphorous-bearing mineral). Colour Alteration Indices have been established for both groups of fossils; as the diagram above shows, the index values are calibrated against Vitrinite Reflectance values and hydrocarbon generation parameters; these calibrations are based on many thousands of samples. Although colour alteration does not give a direct measure of rock temperature, the calibrations allow a direct comparison with other measures of paleotemperature.
Mineral Thermometers
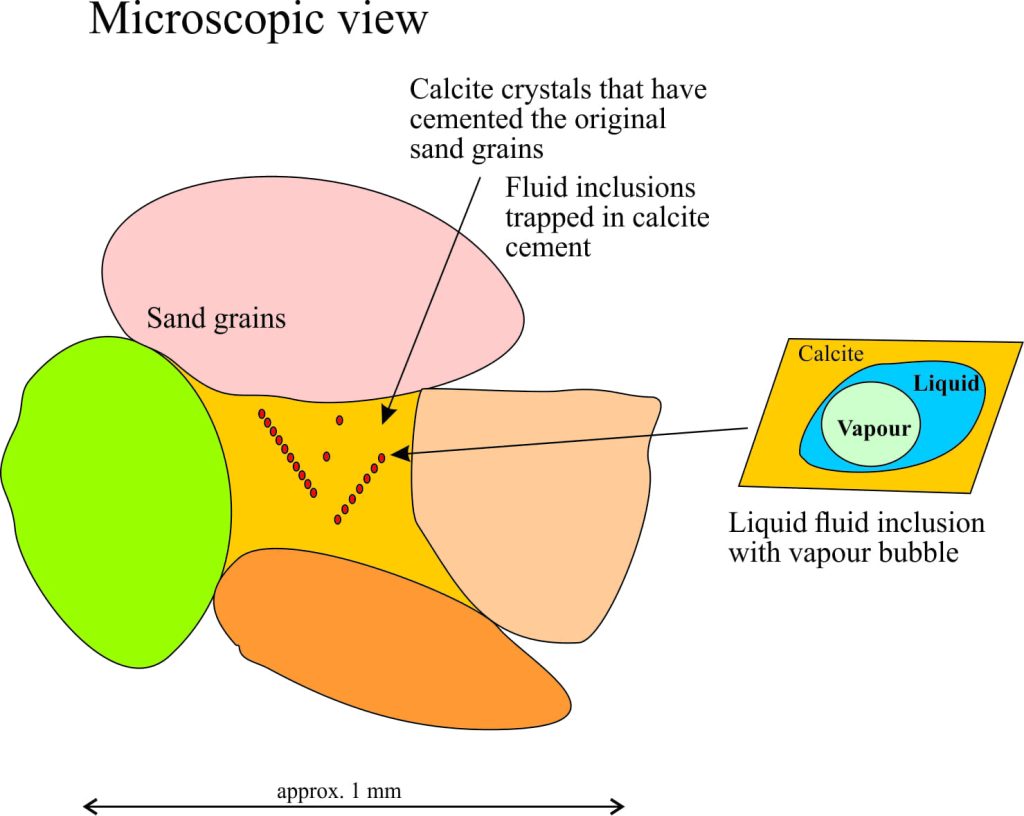
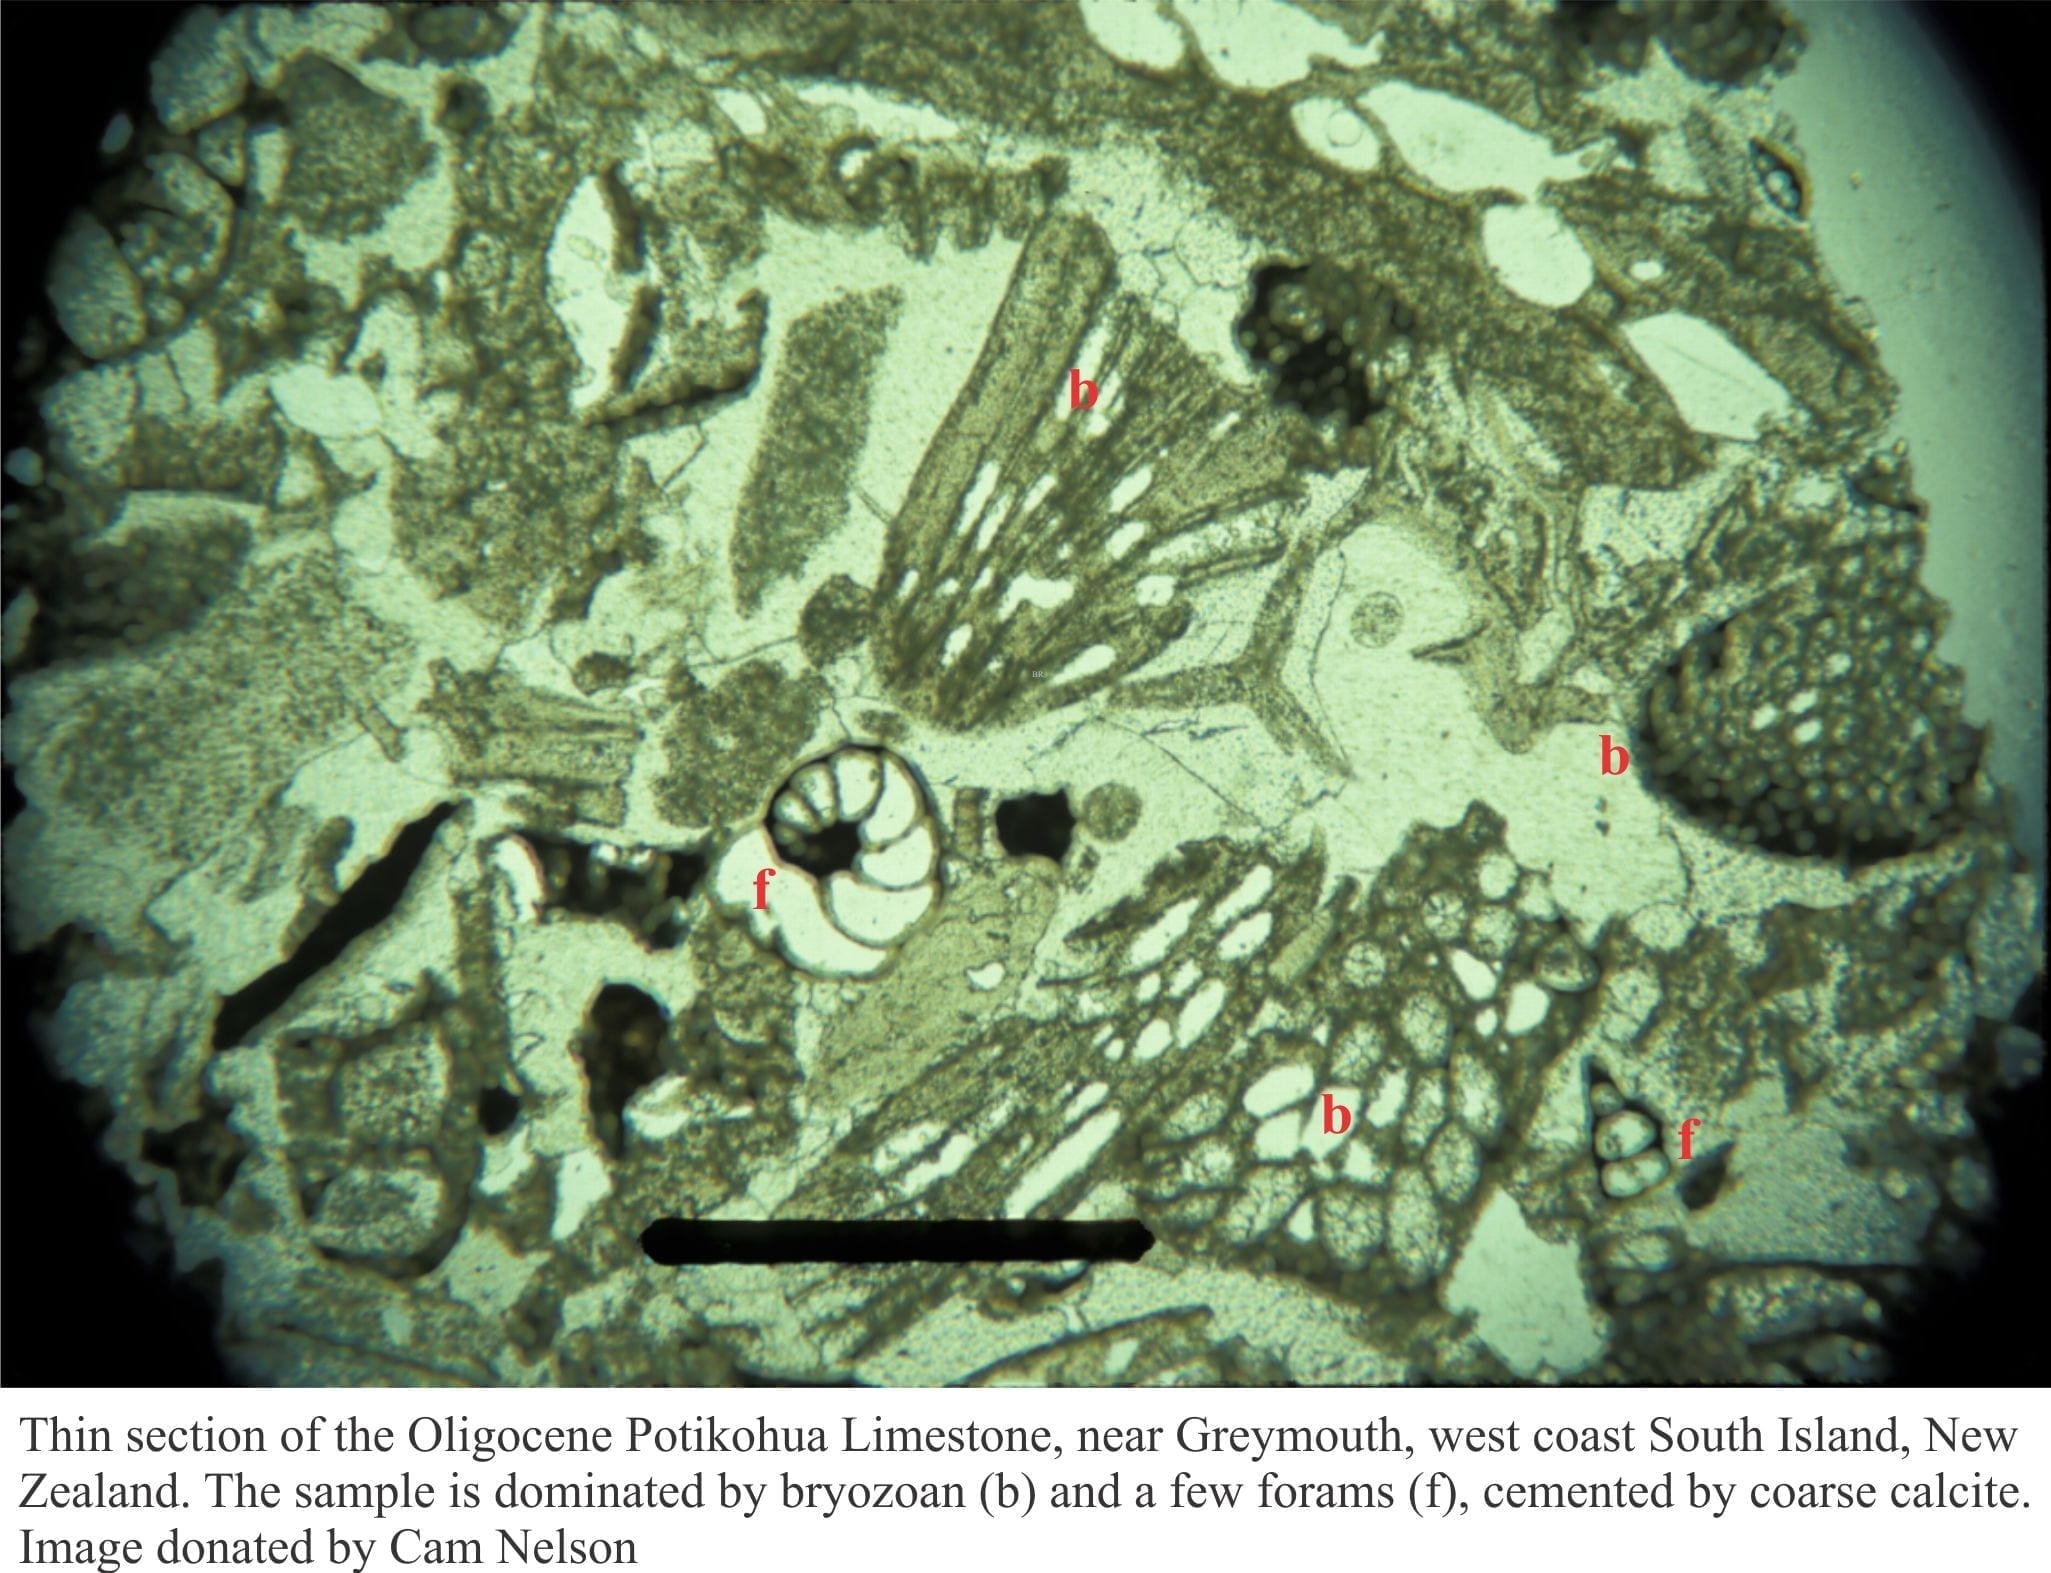
Minerals also contain microscopic records of past temperatures within the crust. When minerals like quartz and calcite precipitate, imperfections in the form of microscopic bubbles are incorporated in the crystal. Most are less than 100µm (0.1mm) long. These bubbles, or inclusions usually contain small samples of the fluid from which the minerals were originally derived – hence the term Fluid Inclusion. They provide us with samples of the ancient fluids that once percolated through the sedimentary rock. The fluids within may be fresh or brine waters or hydrocarbons. Hydrocarbon fluid inclusions are of particular interest because they provide evidence for oil and gas migration through the permeable rock. Notably, fluid inclusion technology is also used to determine the composition of ancient air that is trapped in ice.
Inclusions that are most useful for paleotemperature analysis contain both liquid and its associated vapour. The method is relatively simple; samples are heated while being viewed under a microscope. The temperature at which the liquid and vapour homogenize into a single fluid is recorded as the temperature under which the inclusion, and therefore the mineral crystal formed. Unlike the methods that use organic matter, fluid inclusions provide an actual temperature of formation.
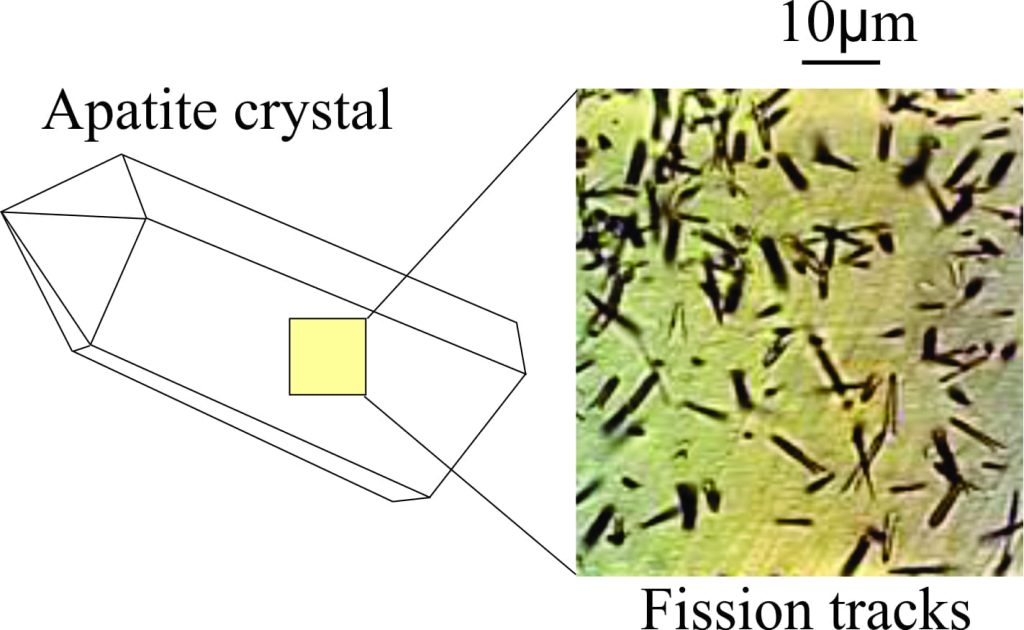
Fission Track analysis using the mineral apatite provides a different kind of paleotemperature determination. Apatite crystals that form in many sedimentary rocks contain small amounts of Uranium-238. Uranium decay produces a visible track, a few microns long, where the apatite crystal structure has been damaged by radiation. Analysis of the Fission Tracks (in apatite, zircon and other minerals) is widely used to determine the age of rocks. However, the Apatite Fission Track method is also useful for determining if and when sedimentary rocks reached a temperature of about 110oC because at this temperature the fission tracks are annealed (i.e. the crystal defects are repaired). If the rock is then cooled below 110oC fission tracks will again begin to develop. Temperatures of 110oC are common at about 3.5 – 4km depth; if rocks at this depth are uplifted by tectonic forces then cooling can begin. Thus, apatite fission tracks provide valuable information on when rocks reached the maximum 110oC and also when they cooled.
Data limits
Any method that attempts to extract paleotemperatures from rocks, whether temperature proxies or actual numbers, needs to deal with natural variation in data. Vitrinite reflectances from a single location may give Ro values that span 0.5% depending on, among other factors, the nature of the original plant material, preservation and alteration during burial, and the chemical environment during burial. In most cases of paleotemperature analysis, mean values are quoted. Best practice requires that, whatever the method used, the natural spread of data values (mean, standard deviation) and errors are always stated. Of course, this applies to pretty well anything in science that we try to measure.



1 thought on “Measures of Temperature in the Bowels of the Earth”
Pingback: home page