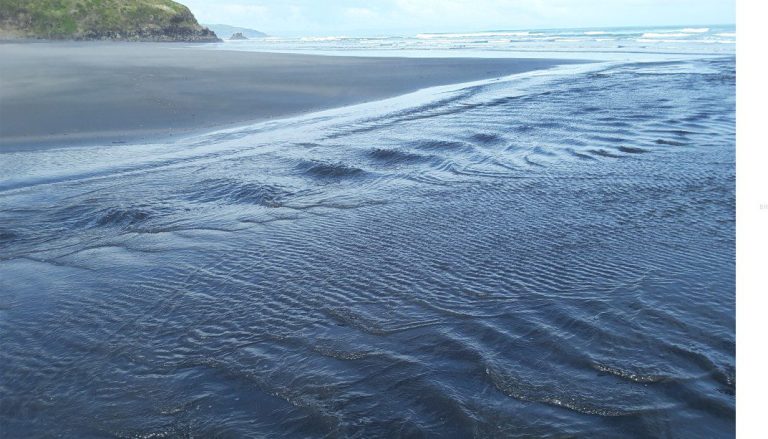
Most of us at some time have gleefully created our own liquefied puddle by stomping on wet beach sand. I once showed my kids, intent on explaining the scientific intricacies of liquefaction, but being teenagers at the time they walked off in embarrassment. But liquefaction is much more than a trick at the beach; it is a process that can have devastating consequences for built structures and natural slope stability.
Earth movement during an earthquake is cyclic; each back-and-forth or up-and-down motion is one cycle. There can be many cycles during those few terrifying seconds. One way to express the intensity of the movement (and earthquake magnitude) is to measure the acceleration of ground displacement (called Peak Ground Acceleration, PGA). A useful analogy is a car that, when the gas pedal is depressed, accelerates to some maximum speed; the acceleration is the rate at which this speed increases. Take your foot off the gas pedal and the car decelerates; your vehicle has completed one cycle. A PGA value is usually expressed as a fraction of ‘g’ (the acceleration due to gravity); the greater the fraction, the greater the intensity. During severe earthquakes most damage occurs because of physical, mechanical shaking. However, there is another process that, in some circumstances, produces severe and widespread damage to buildings and infrastructure – liquefaction.
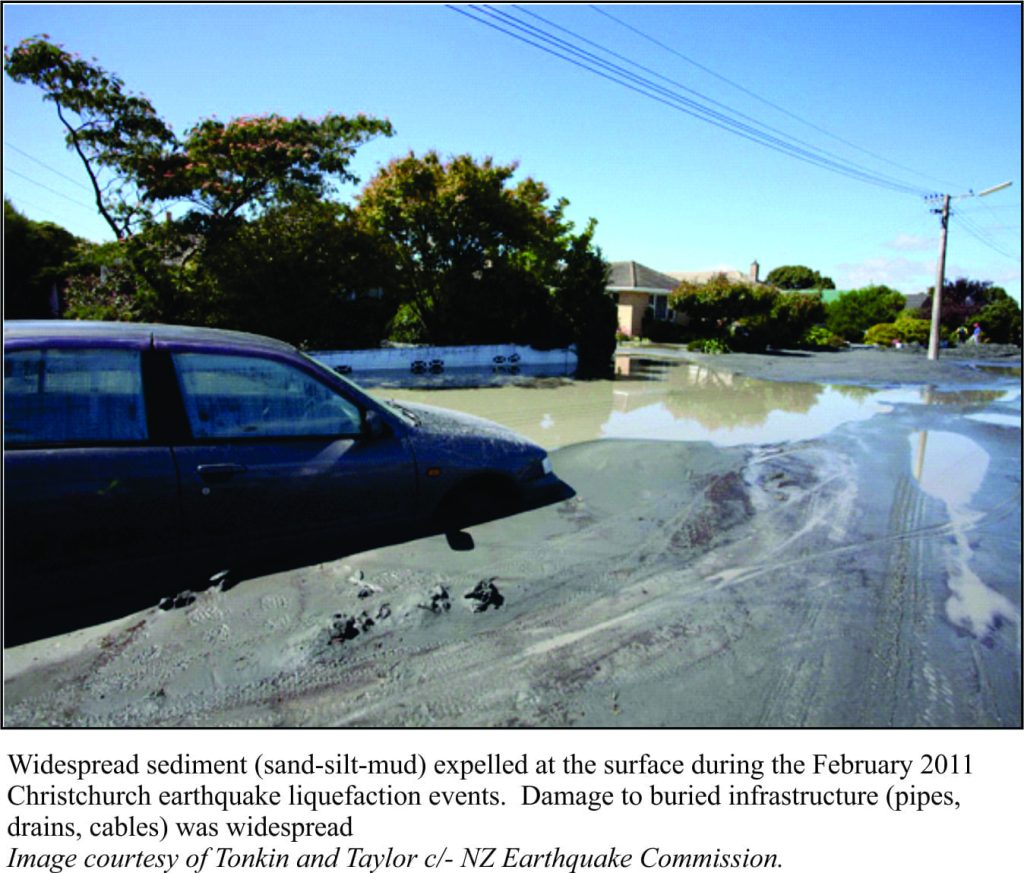
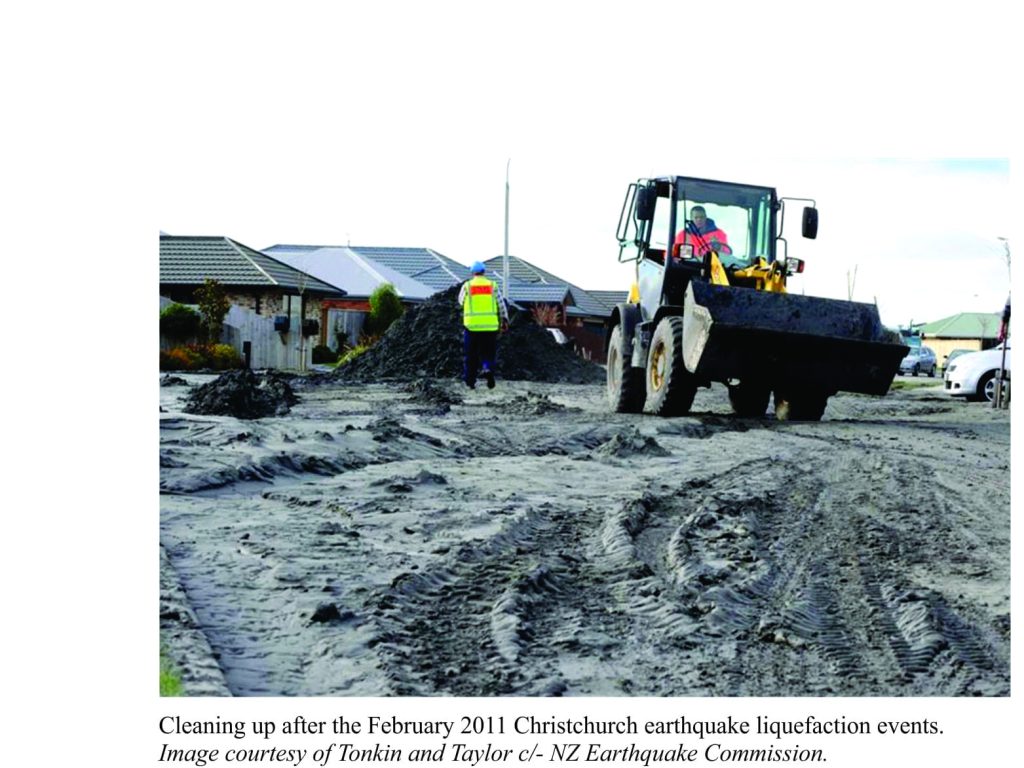 Of the two major earthquakes to hit Christchurch, New Zealand (M7.1 September 2010 and M6.2 February 2011) the second, lower magnitude (but greater intensity) event resulted in the most damage and loss of life (because the epicentre was less than 10km from the city and high PGAs). Christchurch lies on a relatively flat, low elevation flood plain that is underlain by unconsolidated (soft) layers of silt, clay, sand and gravel. The watertable is less than 2m beneath much of the city area. During the 2011 earthquake, liquefaction resulted in water and sediment expulsion (to the surface) over about a third of the city, damaged about 15,000 buildings (6000 beyond repair) and buried water-sewerage pipes, and deposited more than 400,000 tonnes of sand and silt on streets and backyards.
Most of the damage from earthquake shaking takes place above the land surface; most of the damage from liquefaction occurs below it.
What is liquefaction?
Under normal conditions sand deposits have strength, imparted by all those sand grains being in contact with other grains around them; this is the reason you can walk along a beach without fear of sinking up to your neck. This condition also applies to sands below a watertable but in this case all the pore spaces between grains are filled with water. The groundwater fluid pressure in this situation is normal.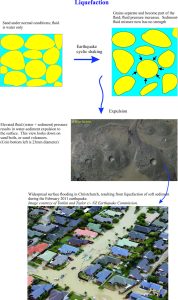 Earthquake shaking applies a cyclic external force to the sand grains and the ground water. If shaking is strong enough the sand grains begin to separate until they reach a point where most are ‘floating’ in the surrounding water. At this point, the fluid now consists not only of water but also the floating grains and a consequence of this is that fluid pressure increases. The sand is now liquefied. In this state it no longer has sufficient strength to support surface loads and their foundations sink. Buried pipes will also move, some breaching the land surface.
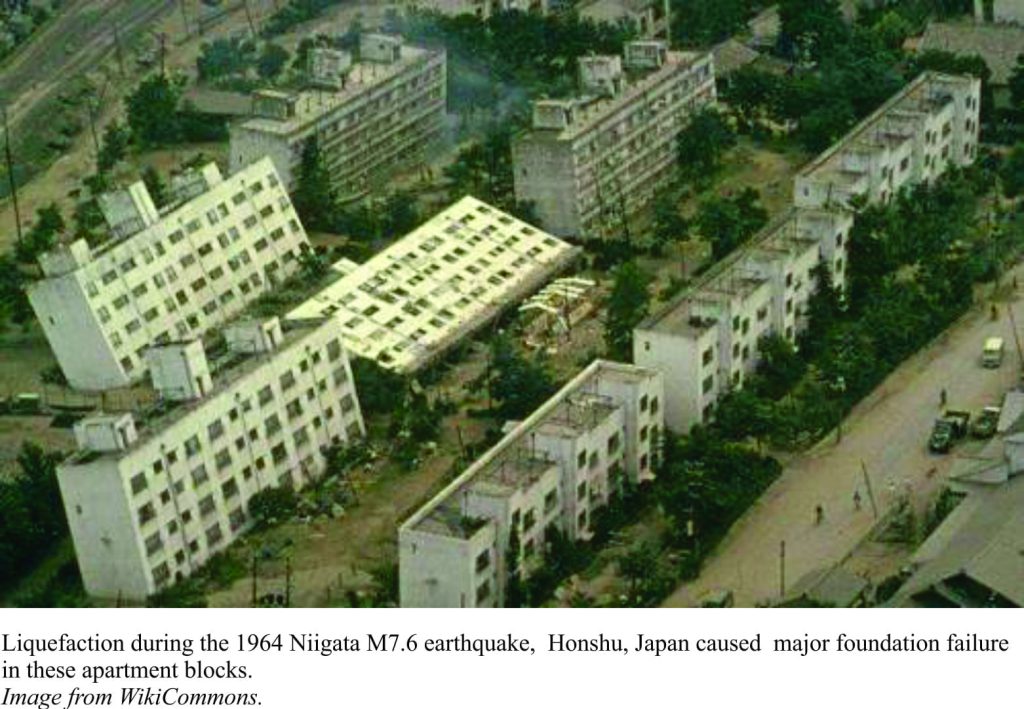
The excess fluid (water + grains) in liquefied sediment is at a higher than normal pressure and will flow towards the surface as boils or sand volcanoes. The 2011 Christchurch earthquake provided some excellent examples of this process (although pretty disheartening for those directly affected). As water plus sediment is expelled the sand grains beneath the surface begin to settle and eventually the process stops. Another spectacular example of foundation failure took place during the 1964 Niigata earthquake on Honshu, Japan. Here, entire 4- and 5-storey apartment blocks literally fell over because of liquefaction beneath the buildings.
Liquefaction beneath the waves
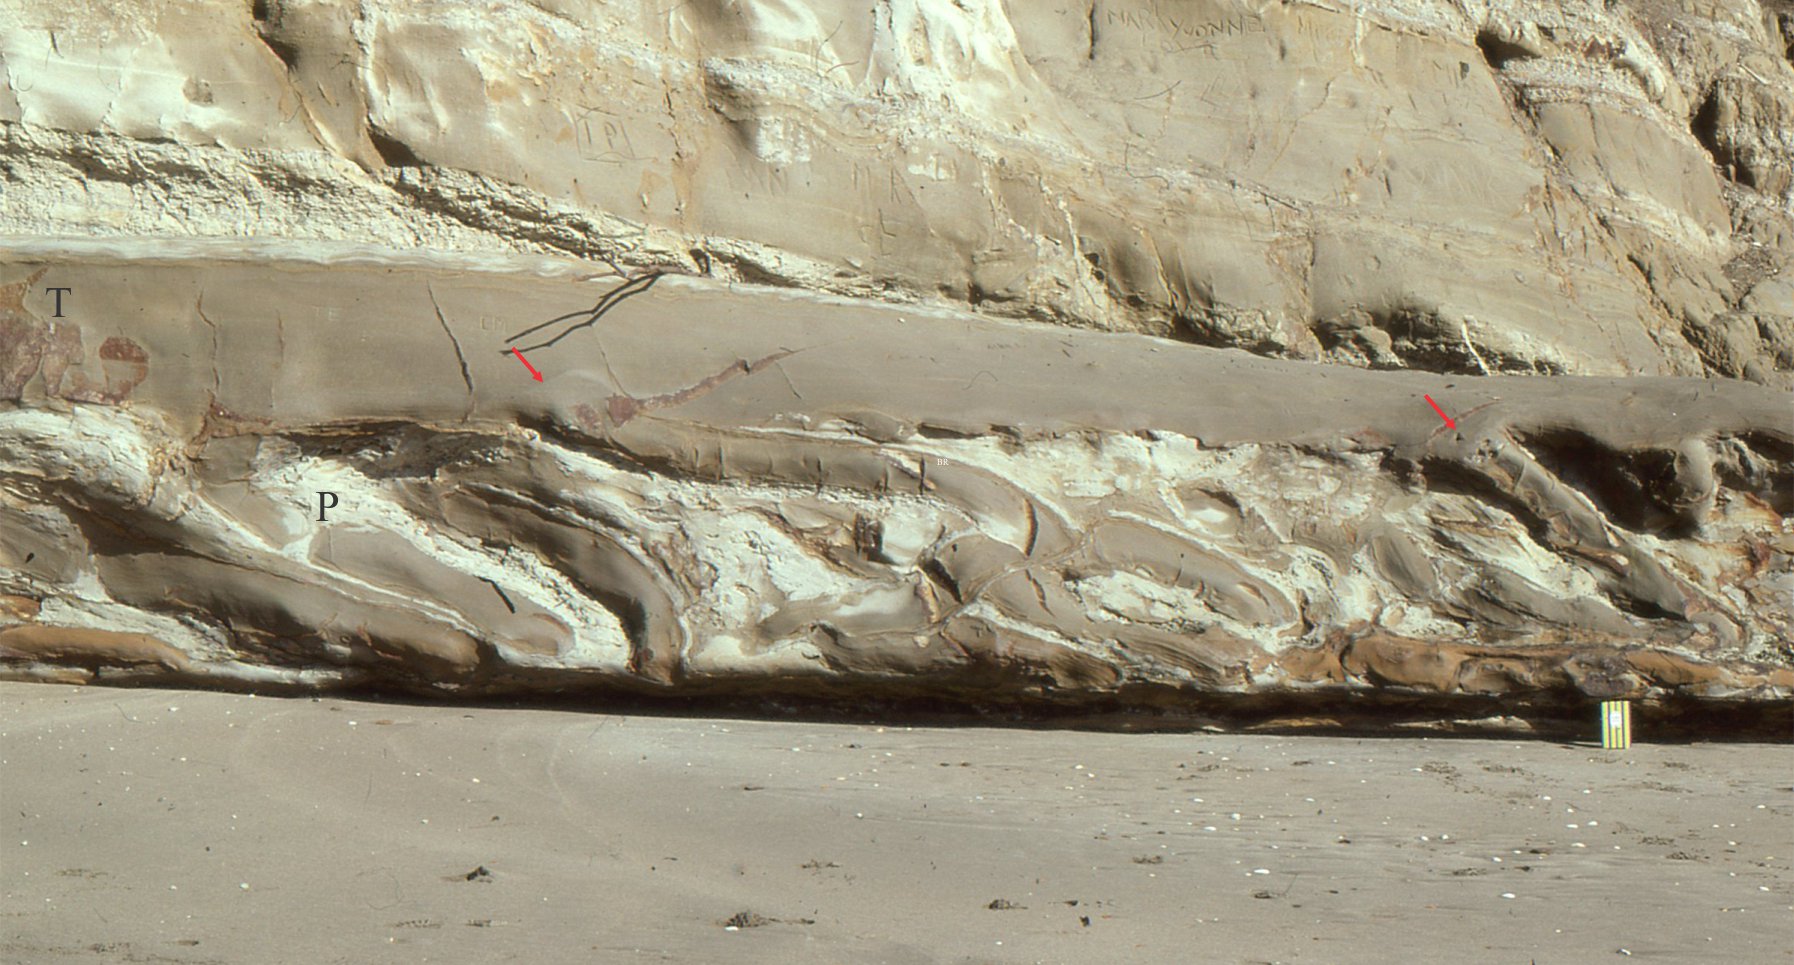
Sediment beneath the sea or lake bed can respond in a similar way to seismic shaking. However, seismic events are not the only cause of submarine liquefaction; the impact of storm waves on the seabed can also produce liquefied sediment. Like earthquake events, this process is also cyclic where fluid pressures increase and decrease as each wave passes. Liquefaction of seabed sediment can result in serious damage and movement of structures such as pipeline, cables, oil rigs, reclaimed land and jetties; it can also trigger submarine landslides and bottom-hugging flows of mud, sand and gravel.
A simple experiment
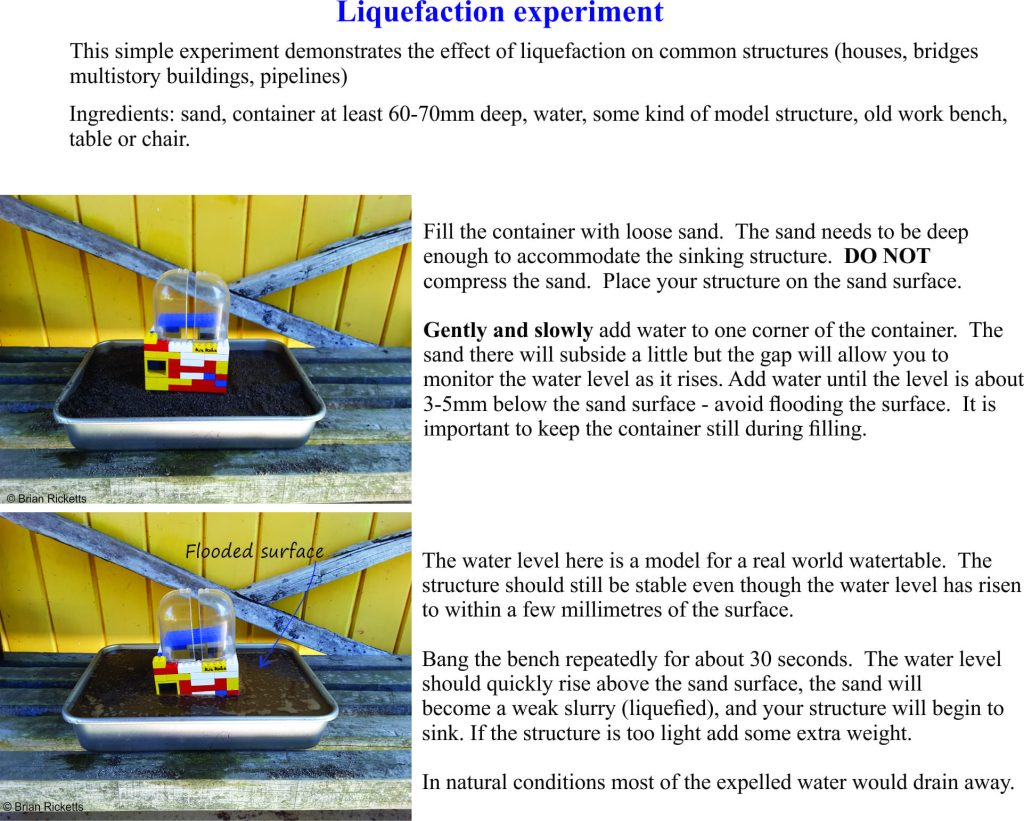
The inset demonstrates a simple experiment where a structure, comfortably resting on a sandy surface, will sink during an experimental seismic event. All you need is a suitable container, sand, water and Lego (or whatever takes your fancy for a surface structure). The instructions are outlined in the diagram below.
Check out these posts on liquefaction structures in turbidites, slumps and slides Sedimentary structures: Turbidites
