Some thoughts on how we record and identify sedimentary basins margins.
Any discussion about depositional systems and sedimentary basins will inevitably require a ĺ reference to a basin margin. What does this mean? Is a basin margin defined by:
- Geomorphological features such as a coastline, a drainage divide, or a fall-line?
- Regional stratigraphic pinchouts and onlap contacts?
- The crustal-scale pivot line where long-term basin subsidence approaches zero?
- The limits of crustal attenuation and other types of crustal loading, both positive and negative?
- Or is it a vague reference to a margin that’s “out there, but we’re not sure where”?
How we visualize the margin of some physical entity depends to a large degree on scale and context. Two ways we can look at sedimentary basins, of relevance to this discussion, are:
- The geodynamic context that recognizes the crustal- to lithosphere-scale underpinnings of all sedimentary basins.
- The stratigraphic context that elucidates the architecture, timing, and composition of the basin fill, and their relationships with the geomorphological confines of a basin.
The fundamental strategy is the geodynamic underpinnings that shape basins, their landscapes (e.g., topography, drainage, weather patterns), the sedimentary fill (terrigenous, carbonates, volcaniclastics), and ultimately a basin’s demise. However, the starting position for any geodynamic analysis is the data we tease from the rock record –
- The thickness, geometry, and chronostratigraphy of mappable stratigraphic units.
- The loss of stratigraphic thickness at unconformities.
- Physical and chemical diagenesis, burial temperatures, and heat flow.
- Rock density and porosity data.
Geodynamic basin margins
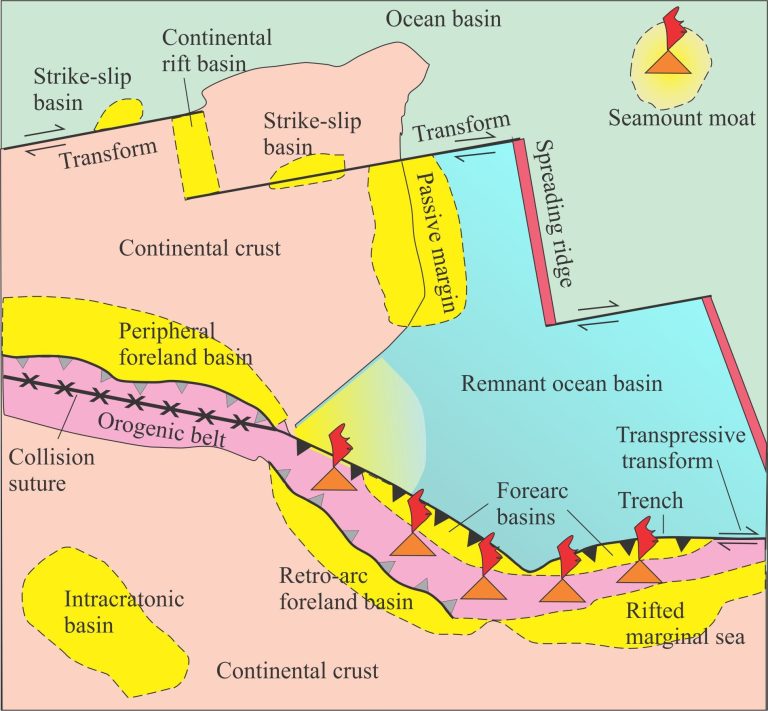
The formation and evolution of sedimentary basins is inextricably linked to plate tectonic forces that are maximized at plate boundaries. Sedimentary basins are generally defined as regions of long-term subsidence. The principal drivers of subsidence are tectonic forces (extension, contraction, and strike-slip), and isostasy. How these processes are manifested determines the type of basin that will form. Common geodynamic subsidence mechanisms include:
- The mechanical response to lithosphere extension (rifting).
- The isostatic response to lithosphere cooling following rifting and crustal attenuation – this is called thermo-isostatic subsidence (e.g., rift basins, continental margins).
- Emplacement of tectonic and dynamic loads across contractional plate margins (e.g., foreland basins; forearc basins).
- Lithosphere- or crustal-scale displacement along transform and strike-slip faults (pull-apart basins, wrench basins).
- The isostatic response to sediment plus water loads (all basin types).
Two- and three-dimensional profiles across any of these basin types will show regions of maximum and minimum subsidence over the life of the basin. In general, the locus of maximum subsidence will correspond to the basin depocenter. Theoretically, the point where subsidence approaches zero would qualify as the basin margin at any point in time. However, subsidence is rarely monotonic over the life of a basin – subsidence rates will accelerate or decelerate in concert with changing plate kinematics, heat flow, and an evolving lithosphere (crust – mantle) density and viscosity:
- The rate of cooling decreases, or heating is reactivated, resulting in changes in density and a corresponding isostatic response.
- The isostatic response to changes in sedimentation rate and sediment load.
- Basin uplift and inversion.
- Uplift and denudation of tectonic loads – for example, the isostatic response to thrust sheet emplacement and subsequent erosion, perhaps in tandem with dynamic loading by a wedge of circulating mantle beneath the upper plate.
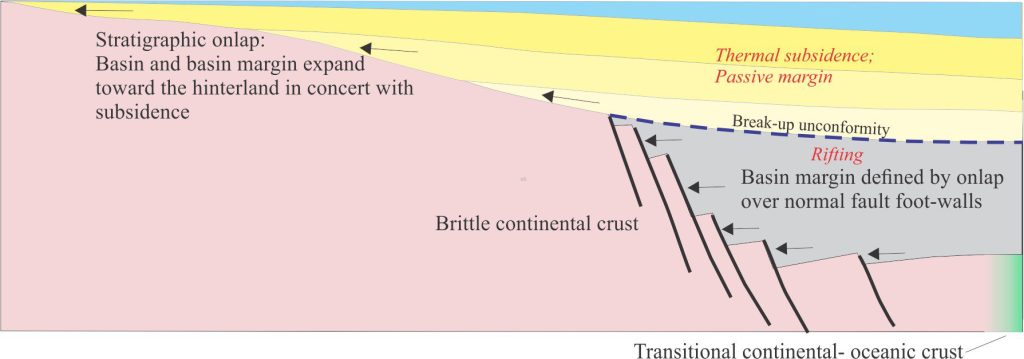
Geodynamic basin margins will migrate in response to changing loads on the lithosphere. Thus, in a very generalised way, the zero-subsidence boundary of a passive margin basin would migrate landward in concert with cooling rates and the increasing sediment load that comprises the continental prism, or wedge.
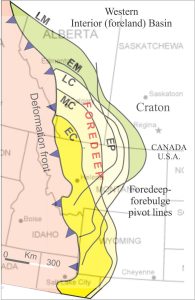
In the case of foreland basins, the basin margin and depocenter axis, that strike approximately parallel to the thrust belt, will move toward or away from the tectonic load (the flexural response) in concert with the isostatic response to thrust sheet emplacement and subsequent erosion (the peripheral bulge will also move in tandem with these geodynamic components).
Stratigraphic margins
Geodynamic processes are the fundamental drivers that generate sedimentary basins and basin margins. But it is the stratigraphic, sedimentologic, structural, composition, and geomorphological records that enable us to map the temporal and spatial nature of these margins; where they were located at any time, and how they evolved over the life of a basin. These records provide the basic data that is fed back into geodynamic models.
The tools required to do this include:
- The identification and mapping of chronostratigraphic units and surfaces (e.g., unconformities) that show regional pinchout and subcrop boundaries (using isopach, biostratigraphic and radiometric data). Mapping in this context means surface and subsurface (seismic profiles, well data, potential field data).
- The use of proxies for depositional margins, such as the two- and three-dimensional changes in sedimentary facies that indicate shoaling and/or the transition from marine to non-marine deposition. Thus, depending on the degree of preservation, we might consider paleoshorelines as approximations for a basin margin, or the landward limit of coastal plain deposits at a fall line.
Note that uplift of a basin margin or wholesale uplift of an entire basin will usually result in erosional removal of some of the stratigraphic record. In this case, the margin you identify will be a margin of preservation rather than a margin of deposition.
Are shorelines suitable proxies?
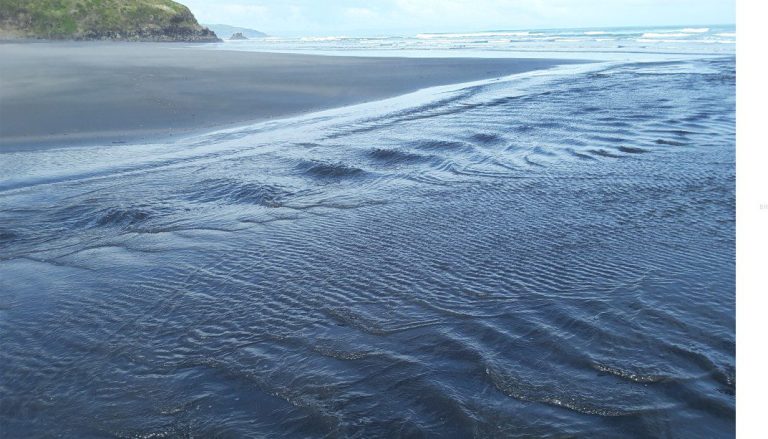
Coasts are probably the most recognizable geomorphic boundaries on the planet. They separate subaerial realms from aquatic realms; there is nothing more fundamental than the separation of marine and lacustrine sedimentary, biological, and chemical processes from those on the exposed land surface.
Coastal geomorphology is diverse. At one extreme there are steep, rugged coasts where foreshores are relatively narrow and coastal plains, where present are discontinuous. Common modern examples include volcanic arcs and islands, the rugged, steep, even mountainous coastal topography at plate boundaries above subduction zones (for example, the Pacific coast of Chile), and relatively steep, fault-bound coasts in rift basins. At the other extreme are the broad coastal plains with their arterial tidal channels and estuaries, wetlands, sand barriers, and lagoons that are common along passive margins.
Despite this diversity, all coasts have one attribute in common – they are ephemeral on human and geological time scales. Coasts are subjected to continual change in morphology and location, where shorelines change shape and migrate landward or seaward, depending on the competitive advantages of terrestrial versus marine processes, viz., eustasy, sediment supply, accommodation space, and the over-arching influence of basin subsidence.
Modern shorelines are so easy to identify that it is tempting to use them as proxies for basin margins. Unfortunately, this apparent psychological advantage falls short when we look at the fossil equivalents of beach and foreshore lithofacies that are commonly difficult to distinguish from shoreface facies. One could argue that, if we can confidently identify shallow shoreface deposits then we must be fairly close to the basin margin. Indeed, where coastal plains are narrow or non-existent, the coast and its associated beach and foreshore lithofacies might provide a close approximation to the basin margin. However, on broad shelves the shoreface lithofacies (that extend to fairweather wave-base) may be many 10s of kilometres from the shoreline.
Where coastal plains are broad, like the modern Atlantic margin of U.S.A. or eastern Australian margin (upwards of 300 km wide), successive shorelines over the life of a coastal plain can potentially lie along trajectories that bear little relationship with the geodynamic basin margin.
Are coastal plains suitable proxies?
Coasts, their shorelines and associated beach-foreshore lithofacies may have questionable value as indicators of basin margins. Perhaps coastal plains in their entirety would better serve this task.
Coastal plain depositional systems comprise a broad range of lithofacies and lithofacies assemblages: beaches, tidal channels and estuaries, lagoons and barrier islands, marshes and wetlands, fluvial channels, delta plains, distributary channels, and interdistributary bays. Coastal plains are the landward extension of continental shelves and platforms. They are characterised by repeated shoreline excursions that record deposition and erosion during regression and transgression. The resulting stratigraphic motifs are Waltheresque – shallowing-upward and deepening-upward stratigraphic trends, complete with subaerial and ravinement discordances, that reflect dip-parallel facies changes.
Modern coastal plains commonly onlap old bedrock. In modern systems, onlap boundaries coincide with fall-lines that locate the change in relief and slope between rocky hinterlands, plateaus, piedmonts, and adjacent gently sloping plains. The changes in relief are commonly presented as narrow bands of waterfalls and rapids along rivers that transect both geomorphic regions. Along the eastern United States seaboard, a fall line exists between the Appalachian piedmont (west) and the Atlantic coastal plain, and extends about 1400 km along strike from New York to Georgia. Along the eastern Australian seaboard, the coastal plain, mostly less than 200-300 km wide, extends more than 3000 km along strike; the coastal plain onlaps Paleozoic bedrock at a fall-line along the eastern edge of the Great Dividing Range.
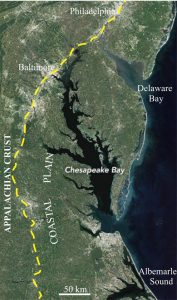
Fall lines associated with coastal plains have supercrustal underpinnings and would be suitable proxies for basin margins IF we could identify them in the rock record. Unfortunately, there are no intrinsically useful criteria in a fall line that would distinguish it from many other paleotopographical structures. The only reliable criteria to do this are the stratigraphic relationships between coastal plain strata and the supracrustal bedrock; in other words, their onlapping or pinchout relationships.
Onlap margins
An onlap surface is generated when successive packages of strata pinchout in a progressively landward position across the top of some pre-existing bedrock. The onlap geometry means that younger strata will terminate at a more landward location than older strata in the same stratigraphic package. The underlying bedrock may be part of an earlier basin sequence or supracrustal basement. Onlap commonly occurs across subaerial unconformities and surfaces of maximum regression. The dip-parallel, landward extent of onlap depends primarily on the basin subsidence profile that is overprinted by changes in relative sea level, sediment accommodation, and sediment supply. Stratigraphic onlap can be generated in all basin types.
Onlap can occur over earlier clinoforms and stratigraphic packages within the same basin succession. In this case the onlap pinchouts are more likely to represent depositional limits within the basin rather than a (geodynamic) basin margin.
Onlap that progresses over much older bedrock (i.e., bedrock that is not part of the overall basin succession but acts as its foundation) is a good approximation of a basin margin; in this case the progressive landward shift of onlapping strata corresponds to a basin margin that migrates in concert with subsidence.

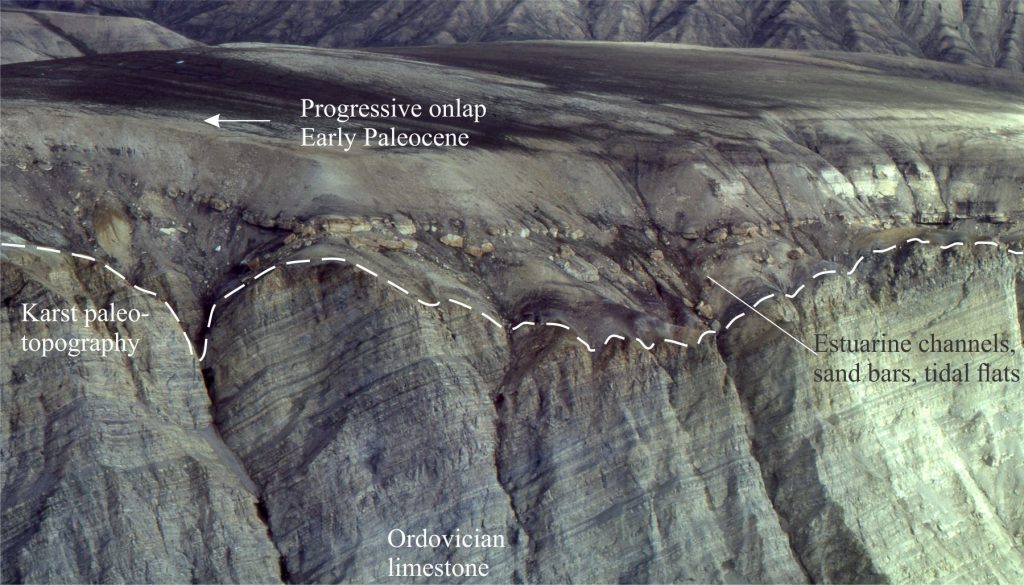
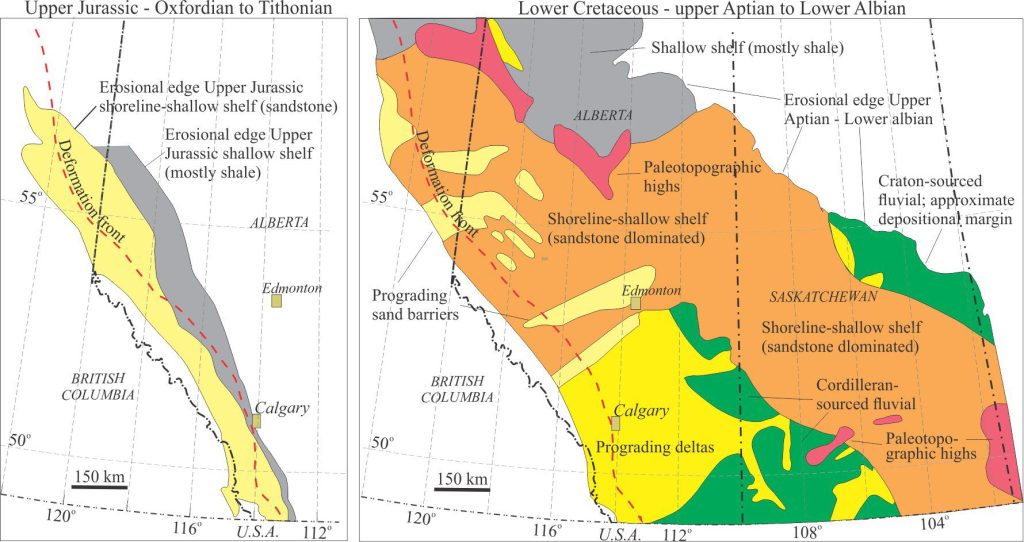
Onlapping stratigraphic packages can be identified by surface mapping, but it is in dip-parallel reflection seismic profiles that they are best expressed. The limits of onlap can also be represented by outcrop and subcrop isopach maps. Subcrop maps are a common hydrocarbon and groundwater exploration tool where the primary databases are well intersections and seismic reflections. One of the goals of these maps is to define pinchouts and the onlap geometry of time-bound stratigraphic units. A couple of examples are shown below.
Stratigraphic pinchout limits identified in this way fall into two categories:
- The outcrop and subcrop limits are depositional, and where they onlap bedrock can reasonably interpreted as margins of deposition. Ideally, sedimentary lithofacies in the map units should indicate progressive shallowing or a transition from shoreface to coastal plain or fluvial as the basin margin is approached.
- The outcrop and subcrop limits are erosional. This category is probably the most common. Whether the erosional limit of a stratigraphic unit is a reasonable approximation of the basin margin will depend on an assessment of the lithofacies. For example, if the erosional limit preserves only outer shelf or slope deposits, then it is a safe bet that the equivalent shallow water, coastal plain or fluvial deposits have been removed – the erosional limit in this case would not be a reliable approximation of the basin margin. In the examples shown, the Upper Jurassic subcrop limit (left) is erosional – the lithofacies indicate that the basin margin was probably some distance farther east (towards the craton). In the Lower Cretaceous map, the southeast subcrop limit, although erosional, contains shoreline and fluvial transitions, and thus is probably quite close to the original depositional margin.
General statements
- Geodynamic processes determine the nature of sedimentary basins and the spatial-temporal history of their margins.
- We can unravel the history of a basin margin (and the basin itself) by decoding the stratigraphic and sedimentologic record.
- Ancient beach – foreshore deposits on their own may not be reliable indicators of a basin margin, unless they can be placed at stratigraphic pinchouts associated with older supracrustal rocks.
- Onlap or landward pinchout of shelf-coastal plain depositional systems and the lithofacies transitions that are embedded in their stratigraphic motifs (shallowing- and deepening-upward trends) will provide a more reliable approximation of a basin margin.
- The preserved margins in many basins are erosional. The proximity of these erosional limits to an original depositional margin will depend on an assessment of the preserved lithofacies.
Other posts in this series
Sedimentary basins: Regions of prolonged subsidence
The rheology of the lithosphere
Isostasy: A lithospheric balancing act
The thermal structure of the lithosphere
Classification of sedimentary basins
Stretching the lithosphere: Rift basins
Nascent, conjugate passive margins
Thrust faults: Some common terminology
Basins formed by lithospheric flexure
Basins formed by strike-slip tectonics
Allochthonous terranes: suspect and exotic
Source to sink: Sediment routing systems
