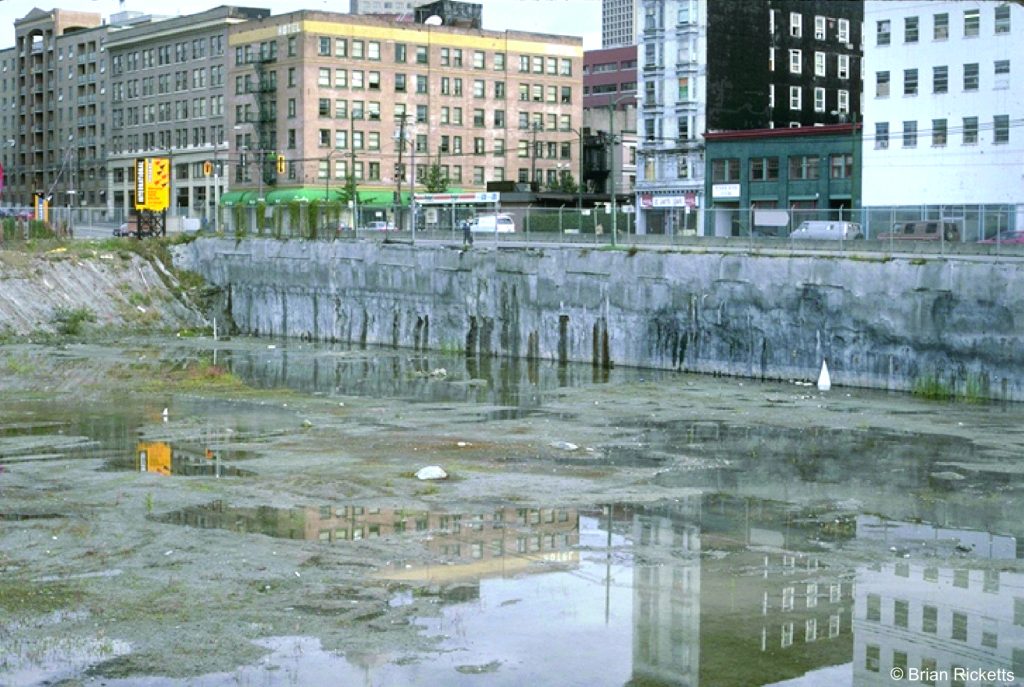
 Concrete on the wall of this downtown Vancouver construction site prevents seepage of creosote (from old milling operations)
Unfortunately, because of foolishness, greed, and ignorance, we have managed to contaminate many important aquifers
The incident (September, 2016) involving wastewater ingress via a sinkhole to the Floridan Aquifer in Polk County, Florida is yet another reminder of the susceptibility of groundwater to contamination. Other recent events like the 2016 Samarco tailings dam failure in Brazil (caused by loading of weak, groundwater-saturated materials), the 2010 Kolantar red mud dam failure in Hungary (mostly caustic, iron oxide, aluminium oxide, but worrying levels of chromium, lead and mercury), and Imperial Minerals 2014 Mount Polley dam failure tailings dam failure, all had immediate and devastating effects on surface water. In the longer term it is likely that downstream shallow aquifers have also been compromised.
Shallow, unconfined aquifers commonly have a hydraulic connection to water bodies such as streams and lakes. One manifestation of this is rising watertables adjacent to flooding rivers. Seepage of water from one to the other depends mainly on the relationship between the hydraulic head in the aquifer (the watertable in an unconfined aquifer) and the head (i.e. water level) in the stream or lake. Streams draining landscapes that have some topographic relief are more likely to receive water from the adjacent aquifer; this is commonly referred to as baseflow, i.e. seepage that maintains stream flow even during dry periods. This relationship can reverse downstream where the river supplies water to an aquifer. The hydraulic relationship ensures that a contaminant in one (aquifer or water body) will have a high potential to compromise the other.
The fate of contaminants
We usually categorize aquifer contaminants as either point source (i.e. of local occurrence such as tailings ponds, garbage dumps, sinkholes, errant nuclear reactors, or fuel storage sites), or distributed source, one of the most common examples being agricultural nitrates and phosphates; their broad distribution generally makes them more difficult to deal with.
The fate of a contaminant is shown in the diagram below. It begins its journey as a relatively coherent slug of nasty industrial waste that seeps through the unsaturated part of the aquifer towards the watertable. In this example the contaminants are dissolved in water. As the contaminant enters the watertable, a plume begins to develop; this plume is carried with the flowing groundwater, and as it does so it mixes with local groundwater. Mixing tends to dilute the contaminant, but it also ensures that the plume will expand over an area significantly broader than when it first entered the aquifer.
Oil-based contaminants – a triple whammy
Petroleum-based contaminants like gasoline and diesel (leaking tanks, oil-field spills), or other organic liquids (e.g. dry-cleaning fluid) create a different set of problems compared with water-based (aqueous) fluids. Light oils or gasoline will ‘float’ on the watertable whereas dense organic liquids such as coal tar will tend to sink through the aquifer. A small amount will dissolve in the aquifer water and move as a contaminant plume. An additional problem occurs with volatile liquids, such that a vapour phase (fumes) can also exist in the unsaturated zone above the watertable. Thus there can be three parts to the contamination: a liquid phase of relatively pure contaminant (e.g. diesel), a dissolved phase in the groundwater itself, and a vapour phase in the unsaturated zone. Any remediation of events like these requires removal or stabilization of all three components.
How long until that spill reaches my well?
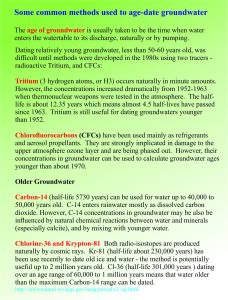
One of the important questions for any contamination event is ‘how long will it take for the plume to reach water supply wells (or perhaps the local river, lake, or estuary)’? If we know the age of groundwater we can estimate the aquifer recharge rate as well as the time required to flush the contaminant through the aquifer.
Groundwater flow rates in aquifers, even shallow ones, are pretty slow – on the order of centimetres or metres per day or year. This means that groundwater tends to be quite old. The obvious corollary is that contaminants can also remain in groundwater for a very long time. Groundwater contamination that affects water supply is definitely not a trivial event.
Some examples of groundwater age are listed below; they range from extremely old, to relatively young. However, even a ‘few years’ disruption of water supply can be catastrophic for individuals, communities and industry.
Young groundwater (i.e. less than say 50 years) is generally found in aquifers a few metres to 10’s of metres deep. As a general rule, the deeper the aquifer, the older the groundwater – it has taken longer to get there.
Really old water
Great Artesian Basin, Australia Recharge flow rates average 1-5m/year; water ranges in age from a few 100 years to about 2 million years old.
Ogallala Aquifer, central USA An oft quoted number for recharge rate is 6000 years; some deeper untapped parts of the aquifer will contain older water.
Relatively young water
Cook Inlet, Alaska Wells sampled in unconfined glacial outwash and river deposits indicate recharge within about 25 years, some shallow wells (10-15m deep) as little as 3 to 5 years.
Upper Floridan Aquifer, SW Georgia Age dates of water from wells in the upper 60-70m of the aquifer units indicate recharge from 9 to 34 years (Source: USGS WRI Report 99-4140)
Canterbury Plains aquifers – Christchurch, New Zealand Water sampled from wells 26-95m deep in shallow alluvial aquifers have measured ages from 10-78 years. Deeper confined aquifers have C14 ages of several 1000 years.
Dealing with the aftermath
The first task is to cut off the source of the offending liquids. This is relatively straight forward if the leak is a one-time event. Unfortunately some leaks (e.g. fuel tanks) can continue undetected for decades.
Contaminated soils can be removed (H&S notwithstanding), but excavated materials need to be stored or isolated and this can be as much of a headache as the original problem. Wells can be drilled down-flow of the contaminant plume and the offending liquid pumped out; again this may need to be stored somewhere or treated. Depending on the size of the plume and nature of the contaminant, pump-and-treat may be required for months or years. Natural dilution in the plume will take place, but it could take decades.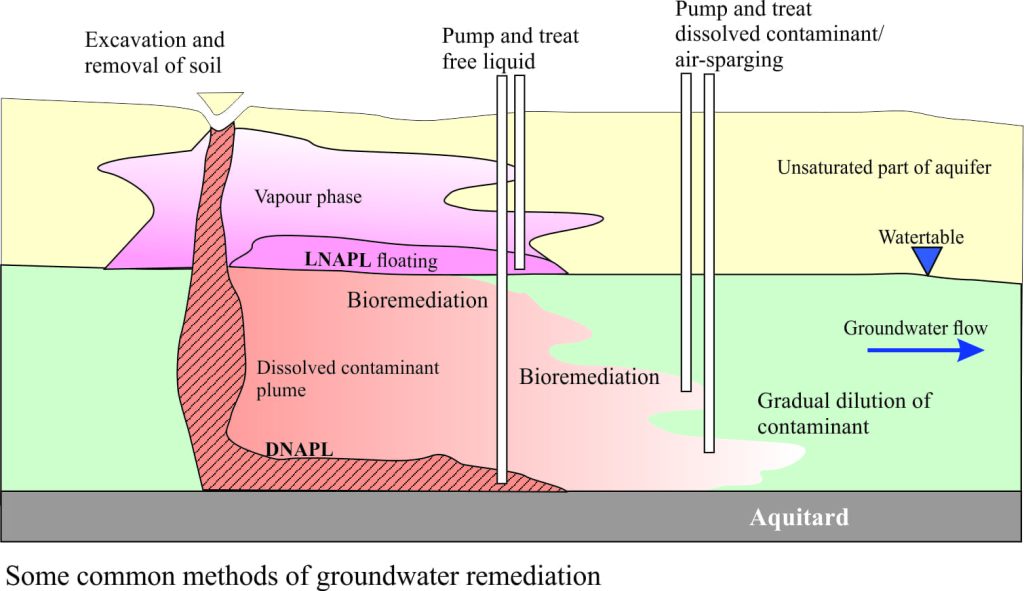 Light fuels that float on the watertable can be pumped (the H&S issues here are not trivial). An alternative method of dealing with volatile liquids is air-sparging, where air is pumped into the contaminant to enhance volatilization. This usually means the vapour/fumes are eventually expelled to the air. If there are toxic compounds in the vapour then this may not be the best practice.
A potential advantage of air-sparging is increased bioremediation wherein the natural microbe biota breaks down some organic compounds. Bioremediation seems to work well in hydrocarbon contaminated sites but if there is an excess of toxic compounds then the method will be less effective. Micro-critters are also known to break down some chlorinated solvents (commonly used in industry), but some of the by-products may be toxic (vinyl chloride is highly carcinogenic).
Clean-up and restoration of contaminated groundwater is an expensive business where costs are usually borne, directly or indirectly by tax payers; an entire geotechnical industry has been built around remediation. One wonders if looking after our most valuable resource might be a better option.


2 thoughts on “Groundwater contamination; messing around with aquifers”
Pingback: nba 2k18 coins
Pingback: fifa 18