Decompacting a stratigraphic column to determine basin subsidence
The analysis of a sedimentary basin begins at the hand-sample and outcrop scale with lithological descriptions and interpretation of sedimentary facies, increasing in scope to the unraveling of larger-scale depositional systems and stratigraphic architecture. How do we use all this information to decipher the long-term profile of the basin in terms of its subsidence and uplift, or the tectonic and thermal events that influenced the overall basin configuration and its sedimentary fill. We can rephrase the question as – can we profile the trajectory of the basin floor, or any stratigraphic interval, over the life of the basin in terms of its subsidence and uplift?
Geohistory, or subsidence analysis is a quantitative method that tracks the locus of stratigraphic units from deposition to burial, and in many cases eventual uplift. It is a one-dimensional analysis that uses data from boreholes and measured stratigraphic sections. J.E. Van Hinte’s iconic 1978 paper introduces the method and is a must-read. Excellent summaries by Angevine, Heller and Paola (1990), and Allen and Allen 2005, 2013 are necessary reading. Guidish et al., (1985) also provide an overview and critique of the methods involved.
The analysis requires the following data:
- stratigraphic thickness as measured,
- a simple decompaction calculation based on porosity estimates that projects changes in thickness during burial,
- the age of stratigraphic units (paleontologic and radiometric), and
- interpreted paleoenvironmental information that allows estimates of paleobathymetry.
The sophistication of a geohistory analysis is improved if we account for the isostatic effects of increasing sediment load during basin filling or unloading during erosion. This technique is called backstripping and produces a numerical measure of tectonic subsidence – this will be dealt with in a separate article.
Stratigraphic thickness and age
Geohistory is a function of age and hence the starting point for analysis is the measured thickness of time-bound lithological units. Ages can be derived directly by biostratigraphic or radiometric methods, or by correlation with other stratigraphic sections. The units may or may not coincide with formation or sequence stratigraphic boundaries – the more units that are identified, the better the analytical resolution.
Sedimentation rates are assumed to be uniform (linear) within each time-bound unit, although rates will vary between units. This assumption will be a source of error if the unit contains significant variations in lithology, such as sandstones separated by thick shales.
All measured geological ages contain errors. An important source of error in the context of geohistory is the presence of stratigraphic discordances that represent lost time. If an unconformity is bracketed by age dates, then the interval can be incorporated into the analysis as a period of non-deposition or erosion. However, stratigraphic discordances within the succession, that represent times shorter than the resolution of the dating methods used, will further compromise the assumption of constant sedimentation rates.
Paleobathymetry
Estimates of paleo water depths are based on sedimentary facies and fossil assemblages. In marine basins, sedimentary and biofacies (including trace fossil assemblages) will guide estimates of water depth. Paleoshorelines are unequivocal depth indicators; assessment of depth everywhere else on the adjacent shelf or platform will be based on educated guesses, using for example, shoreface facies and sedimentary or fossil indicators of wave-base. However, in slope and deep water environments the errors increase significantly. For example, bathyal depths range from outer shelf – about 200 m, to about 2000 m; at the deeper end of this range, paleo depths indicated by microfossil assemblages may vary by more than 200-400 m. To put this into perspective, the >200 m error is equal to or greater than the maximum depth of most continental shelves.
The resolution of elevation above sea level in terrestrial systems is generally poor. The zonation of floral assemblages (macrofloras and palynomorphs) with respect to elevation will have significant errors, a problem that is exacerbated by the mobility of pollen in air and rivers.
Decompaction
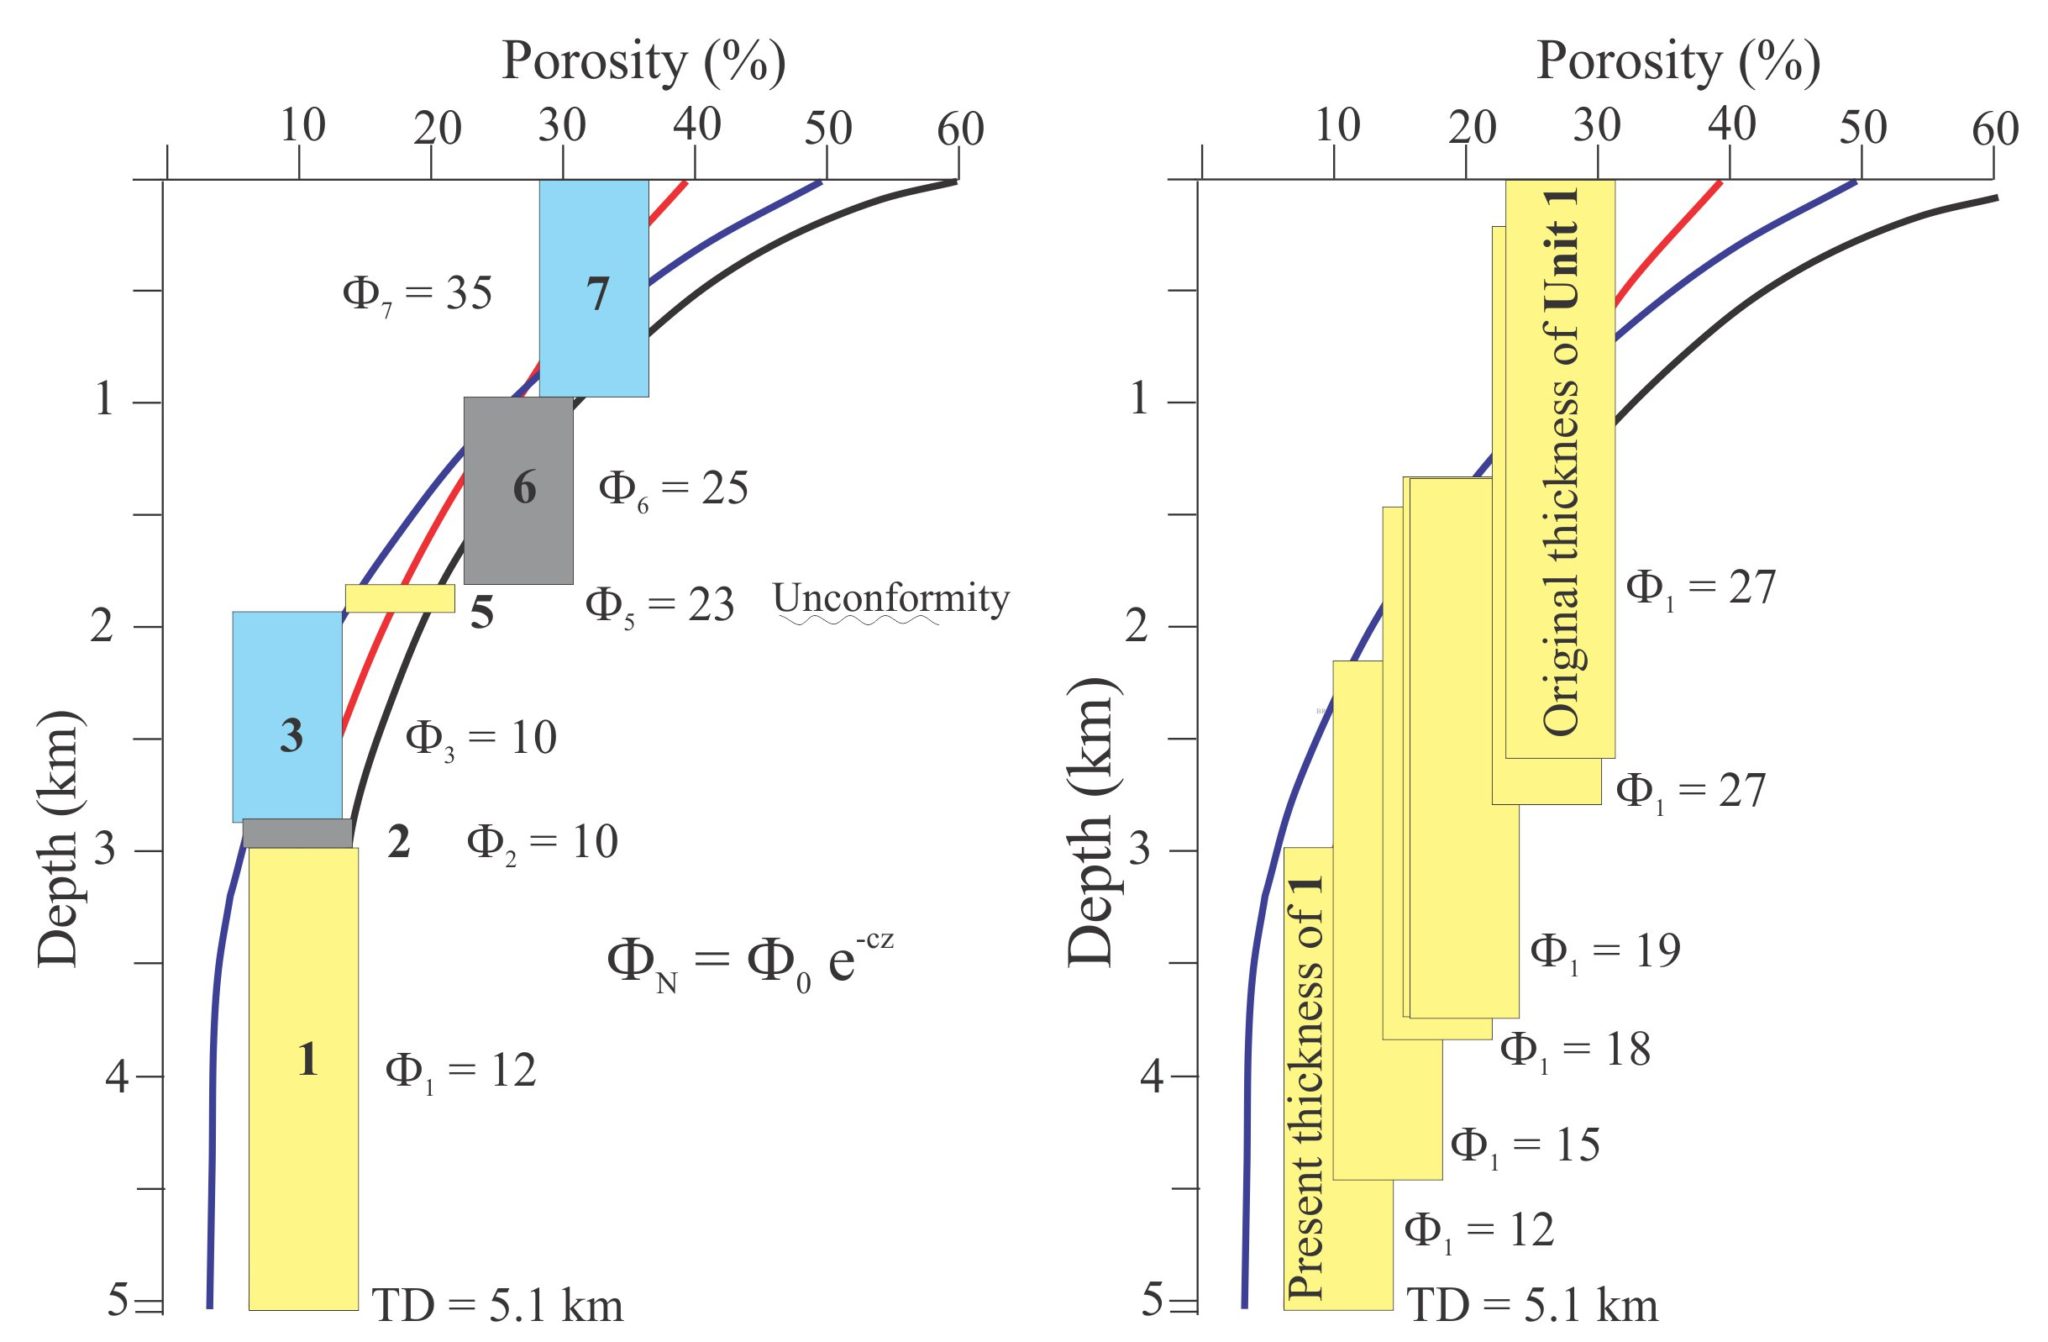
Compaction is a function of porosity loss (assuming no volume change in the solid sediment framework). Compaction corrections attempt to reconstruct the thickness of stratigraphic units at different stages of burial; the maximum thickness for any unit corresponds with zero compaction. The corrections are based on knowing how porosity changes with depth of burial; this is determined by direct measurement of borehole samples or derived from wireline logs (e.g., density, sonic logs). Allen and Allen (2005, 2013) describe the decompaction process as moving a particular layer or stratigraphic unit up a porosity-depth curve, as overlying units are removed sequentially. Empirically derived porosity-depth curves for sandstones, shales, and carbonates have been established for many boreholes.
It is assumed that compaction is uniform throughout a stratigraphic unit – we know that compaction begins immediately following deposition and so the assumption is not entirely correct, but it makes the decompaction calculation that much simpler. Thick units will incur greater errors. Other sources of error in these representations include chemical diagenesis (cements that occlude porosity, or dissolution that creates secondary porosity), overpressured zones that have anomalously high porosities, and lithological variability in any succession.
Ideally, each borehole or field measured stratigraphic section should have its own porosity-depth curve but this is not always possible, so representative curves and their mathematical expressions are commonly chosen.

The decompaction calculation
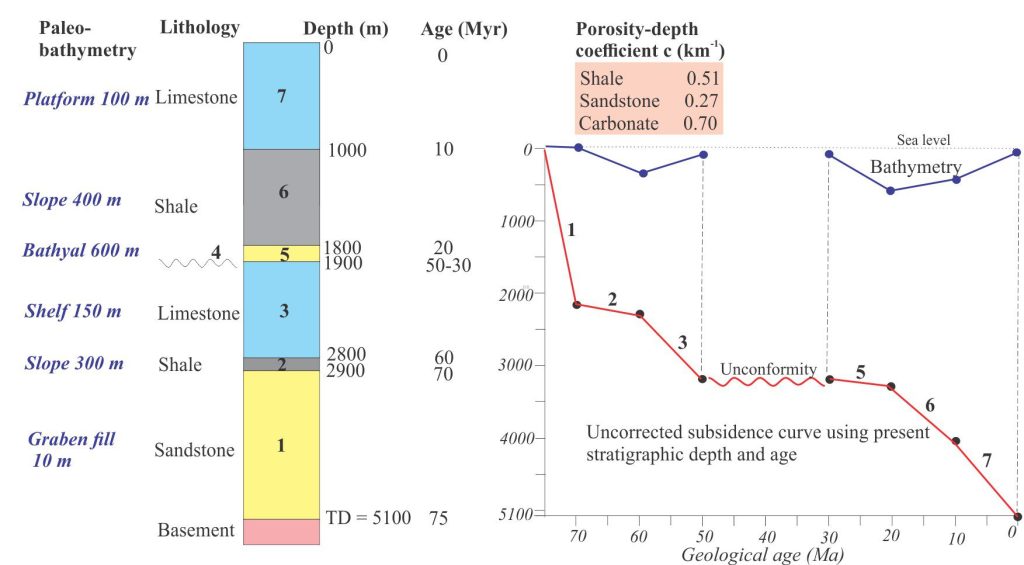
A simple stratigraphic column with all the relevant information serves to illustrate the calculation.
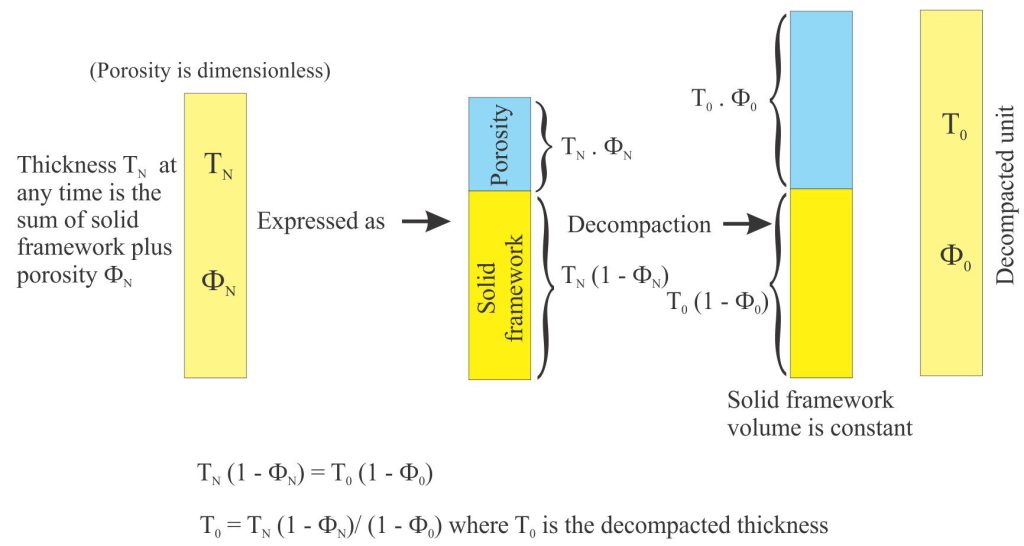
Van Hinte (1978) devised a mathematical method for calculating unit thickness for any time along a porosity-depth curve (summarised in the diagram below); this was restated by Angevine et al., (1990) as:
T0 = (1-ΦN).TN/ (1-Φ0) (1)
where T0 is the original thickness deposited, Φ0 is the original porosity, ΦN is the present porosity, TN is the present thickness. The values commonly used for Φ0 are derived by direct measurement in the lab or field; for example, the initial porosity of clean sands is about 30-35%. More sophisticated calculations (using integral calculus) determine thickness at any point on the curve (see Angevine et al., 1990; Allen and Allen 2005, 2013 for details), but Van Hinte’s method is useful for illustrating the basic method.
A simple equation that expresses the porosity-depth curve as an (approximate) exponential function is:
ΦN = Φ0 e-cz (2)
where ΦN is the porosity now or at some point on the curve, Φ0 is initial porosity (at deposition), c is a coefficient representing the slope of the porosity-depth curve for different lithologies, and z is depth. The calculated value of ΦN is applied to equation (1).
Van Hinte’s calculation is iterative. In the diagram below, Unit 7 is assumed to be at its original porosity and hence does not need to be decompacted. The first step is to remove Unit 7 and move the remaining units up their porosity-depth curves such that Unit 6 is at the top and at its original porosity, and therefore original thickness. The porosity and thickness of each unit is calculated using equations (2) and (1) respectively. This procedure continues by removing Unit 6 so that Unit 5 is at the top, and recalculating porosity and thickness for all the underlying units. Note that Unit 4 represents the unconformity and hence has zero thickness and porosity. The complete list of calculated values is shown in the diagram below.
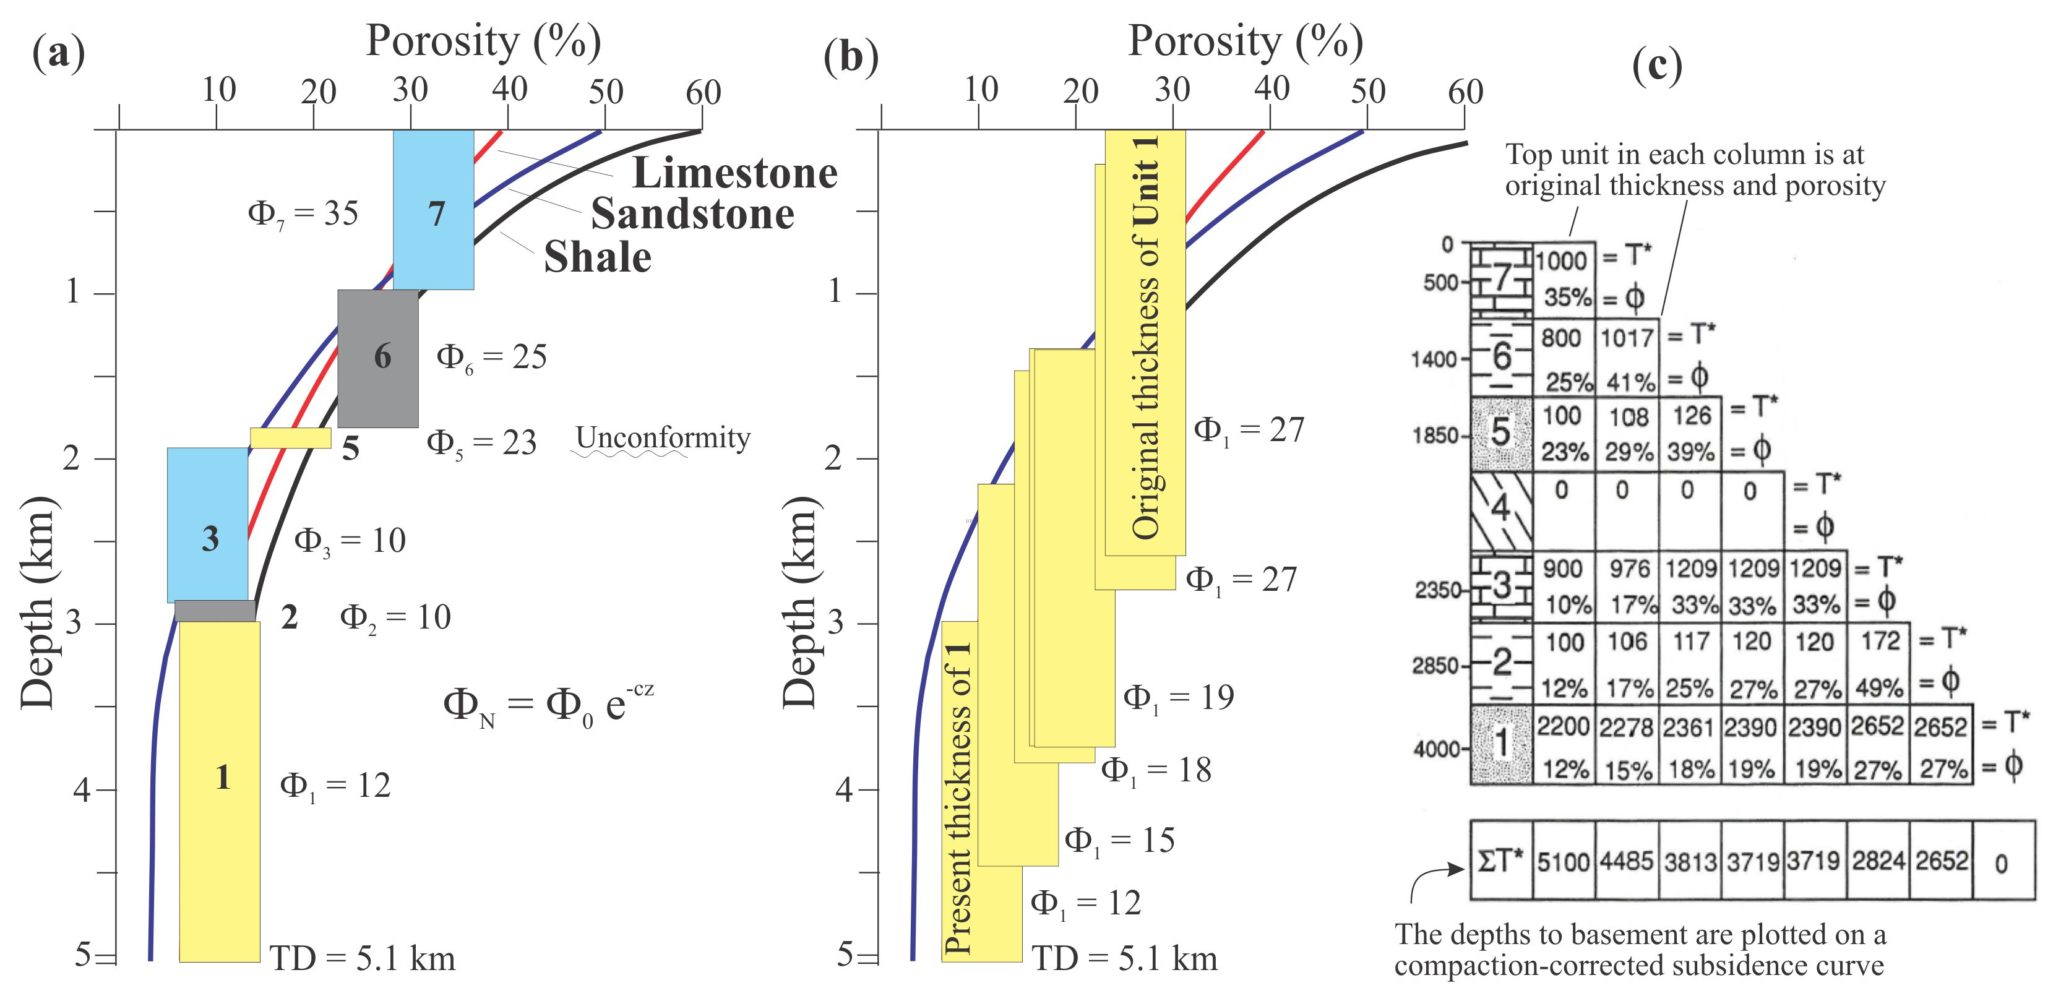
The compaction-corrected subsidence curve for the base of the stratigraphic succession can now be plotted; bathymetry corrections are also added.
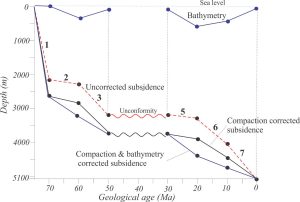
The method shown above lends itself to computer code and rapid analysis. This is important if more sophisticated methods of calculation for porosity and depth are used. However, the basic principles remain the same.
The next step in geohistory analysis is to account for the isostatic effects of sediment and water load. This is the subject of a companion post.
Other posts in this series
Sedimentary basins: Regions of prolonged subsidence
The rheology of the lithosphere
Isostasy: A lithospheric balancing act
The thermal structure of the lithosphere
Classification of sedimentary basins
Stretching the lithosphere: Rift basins
Nascent, conjugate passive margins
Thrust faults: Some common terminology
Basins formed by lithospheric flexure
Basins formed by strike-slip tectonics
Allochthonous terranes: suspect and exotic
