Fluid flow at lithospheric scales
There’s not much that goes on in sedimentary basins that doesn’t involve fluids, particularly the aqueous kind. In sedimentary basins, subsurface fluid flow governs sediment compaction, the transfer of dissolved mass that produces a swath of diagenetic and metamorphic changes, heat flow, and mineralization. At the shallowest crustal levels, fluid flow is responsible for supplying groundwater to a third of Earth’s population.
Beyond the confines of sedimentary basins, fluids transfer mass (fresh water, carbon dioxide, methane, hydrocarbons, dissolved mass) and heat throughout the crust and lithosphere mantle where they play a significant role in dynamic, magmatic, and chemical processes. Water and its dissolved constituents, particularly carbon as aqueous CO2 and carbonate, are recycled from oceanic crust to the mantle lithosphere via subduction zones. Some of this interstitial water will be recycled during compaction, and some will be incorporated into the crystal lattices of common minerals such as clays, amphiboles and various micas, that in turn may be released during high temperature dehydration reactions, and eventually expelled to the atmosphere and hydrosphere.
Fluid flow of volatiles in the lower crust – upper mantle is slow, mostly accomplished along grain and crystal interfaces. Despite this seeming lethargy, these deep fluids are capable of transferring huge volumes of dissolved mass during metamorphic reactions.
The role of fluids and fluid flow in crustal and lithosphere-scale processes is illustrated using two examples: thrust faulting, and subduction zone fluids and magmas.
The mechanical paradox of thrust faulting
Dynamic processes like faulting are enhanced by the presence of fluids at elevated pressures. This is an important concept, first recognized by Hubbert and Rubey (1959 – PDF available). The starting point for their sophisticated analysis was the dilemma presented by the mechanics of overthrusting along shallow-dipping fault planes. Thrust faults can transport thick panels of rock many 10s of kilometres horizontally. The basic mechanical requirement for thrusting to occur is sufficient horizontal force to overcome frictional forces along the fault plane. And herein lies the dilemma – for thrusting to occur, the magnitude of these horizontal forces is so high that the rock body would disintegrate rather than being transported as a coherent structural unit. Hubert and Rubey’s task was to identify a mechanism that reduces friction to the point where real-world forces could be expected to do the job.
Our starting point is to look at fluid pressures at depth, for example in oil wells, represented by the expression:
P = ρw gz
where P is the pressure of interstitial fluids at some depth measured vertically in the borehole, ρw is the density of the fluid (water), g = the gravitation constant, and z the depth from the surface to the point of interest (this expression is derived from Bernoulli’s equation for hydraulic potential). The expression is commonly referenced to two standard conditions:
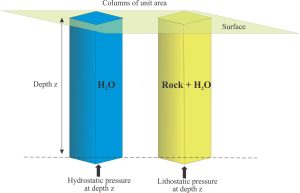
- Hydrostatic pressure: the pressure at depth that supports a column of water extending to the surface (or close to the surface); in this case the pressure at any particular depth is defined by the weight of that water column where the average density ρ is close to one, and
- Lithostatic pressure (or geostatic pressure) that at any depth represents the weight of the overlying column of rock + water. In this case, density ρ is the average bulk density.
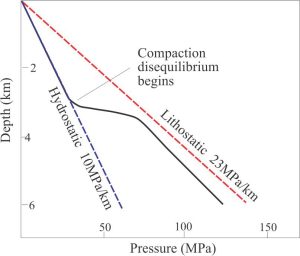
Hydrostatic fluid pressures tend to persist to 3-4 km depth, but at greater depths the pressures deviate from the hydrostatic trend – usually increasing (but in some situations can decrease). This condition is overpressured. In some cases, fluid pressures can approach or exceed lithostatic pressures. Fluid pressures exceeding hydrostatic values have been observed in many deep wells.
The expression P = ρgz can be rewritten in terms of the component of total vertical lithostatic stress Sz:
Sz = ρgz for a water-fluid column of unit area (Pressure = force per unit area, such that P = Sz/1, or P = Sz).
However, because Sz is the sum of the interstitial fluid pressure P plus the weight of the overlying solid rock column (Hubbert and Rubey call this the residual solid stress σz), then:
Sz = P + σz
Hubbert and Rubey demonstrated that for overthrusting to occur, the critical shear stress τ (i.e., the minimum shear stress required to initiate movement across a plane) is equivalent to the vertical residual solid stress σz times a measure of material strength referred to as the angle of internal friction Tanθ:
τ = σz Tanθ
(Tanθ is a rock or material property that refers to its ability to resist deformation and is measured as the angle between the normal stress and a resultant stress at the point where shear begins. The analogous measure in loose sediment or soil is the angle of repose, where slopes greater than this angle become unstable).
Thus, the critical stress at which overthrusting begins can now be written as:
τ = (Sz – P) Tanθ
This all-important equation indicates that as fluid pressure P increases and approaches the value of Sz, the critical shear stress τ approaches zero. Herein lies the elegance of Hubbert and Rubey’s analysis. As fluid pore pressures along the fault plane increase above hydrostatic values, friction is reduced to the point where overthrusting can occur with relative ease. Tectonic compression, differential compaction, and mineral dehydration reactions are some of the more common mechanisms that lead to increased fluid pressures.
The mechanical dilemma presented by overthrusting is resolved!
Fluid flow and partial melting in subduction zones
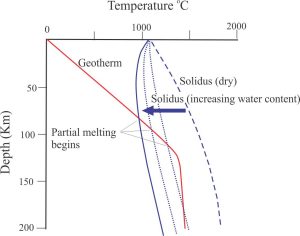
The production of magmas in the mantle is strongly dependent on the availability of water. Flux melting occurs when free water is available at solidus temperatures deep in the crust – upper mantle (the solidus is the temperature at which melting begins – it also defines the lithosphere-asthenosphere boundary). The water acts as a flux, lowering the melting point of different mineral components, thus promoting partial melting. For example, dry granite melts between 1100 – 1250oC, but in the presence of water melting can begin at temperatures as low as 650oC. This is illustrated in the graph below, where the solidus intersects the lithosphere geotherm at progressively lower temperatures, depending on the water content.
Flux melting is an important process in subduction zones. The water required to initiate melting is derived from the descending oceanic crust that contains wet sediment and wet basaltic volcanic and intrusive rock. As subduction proceeds, increasing compaction of the sediment matrix drives interstitial fluid flows to the upper plate, while increasing temperatures promote dehydration reactions in minerals that release water bonded to crystal lattices. Dehydration can begin at temperatures as low as 60oC in clays (Saffer and Tobin, 2011; PDF available); hydrocarbon maturation also begins at about this temperature and becomes increasingly rapid and pervasive at 80o-120oC (the oil generation window). Fluid buoyancy plays a major role in its ascent. Thus, fluids in the subducting slab are partitioned between the upper plate or recycled in the underlying mantle.
The fate of these fluids is a topic of active research because they are implicated in the tectonics of subduction zones, particularly mega-earthquakes and slow-slip along the subduction interface, the evolution of magmatism and volcanic arcs, and potential mineralization. Elevated pore fluid pressures resulting from tectonically induced compression also play a role in the generation of accretionary wedge thrust faults.
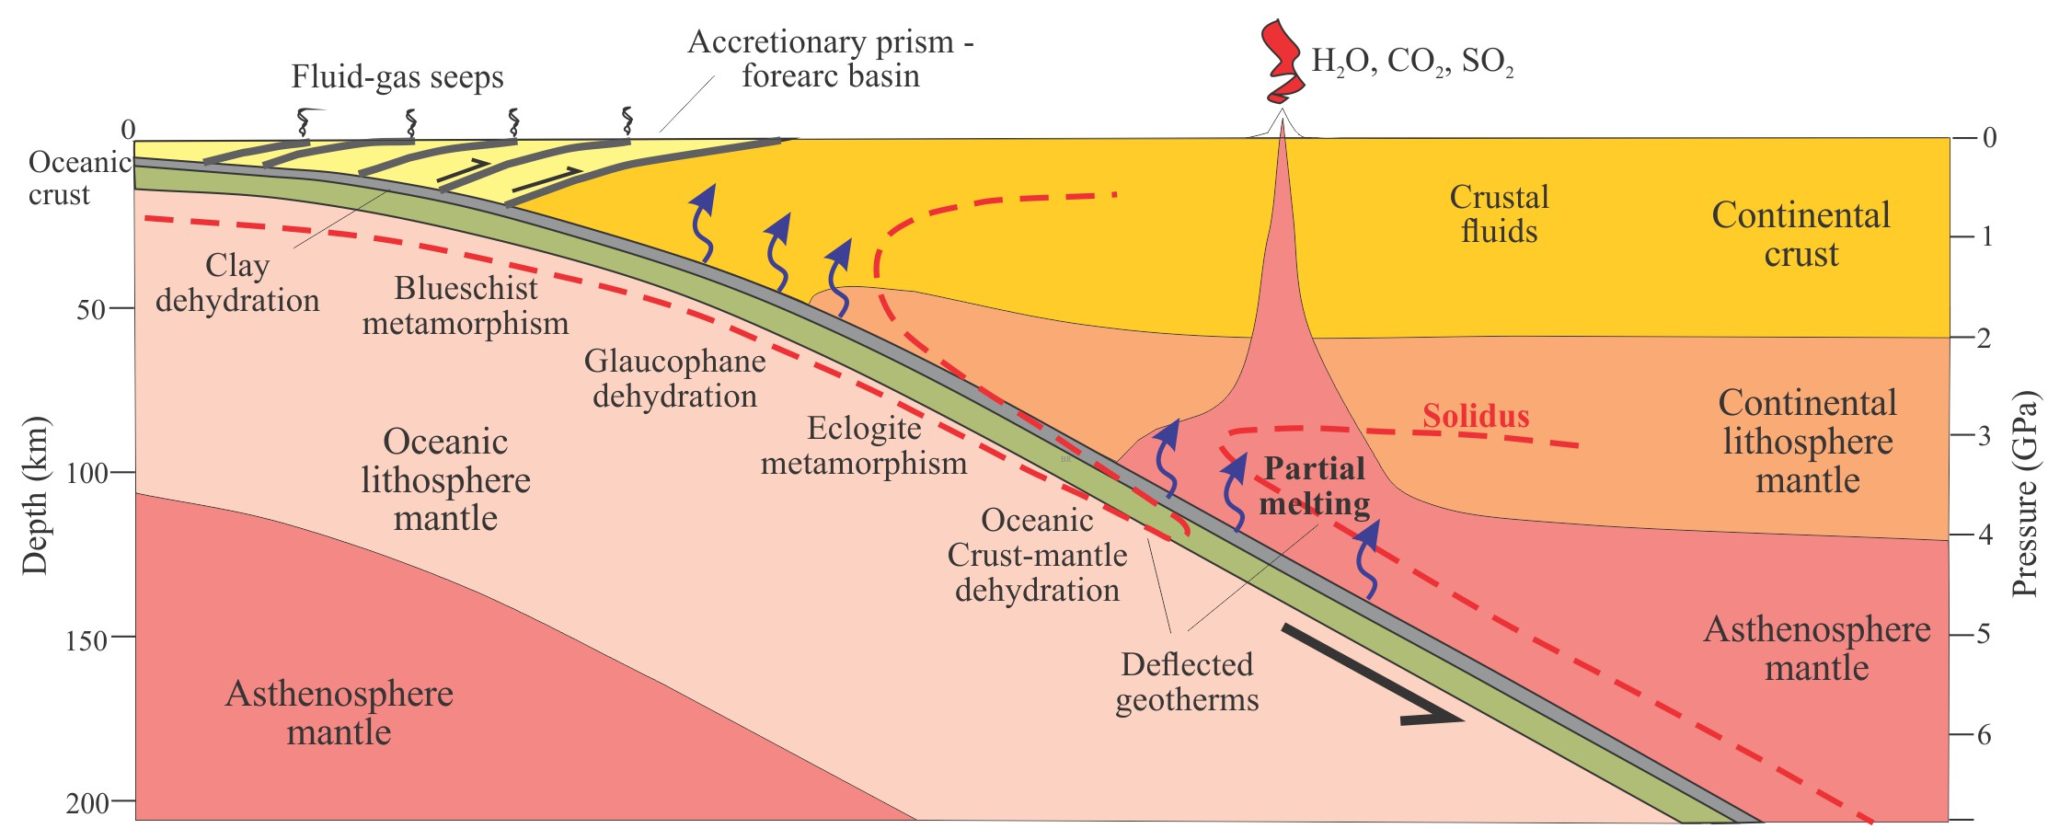
Flux melting at the lithosphere-asthenosphere boundary creates partial melts that rise buoyantly through the upper plate; their ultimate fate is eruption at the surface and the construction of magmatic arcs. Huge volumes of fluid are also expelled to the atmosphere during eruptions – mostly water, plus lesser quantities of CO2, SO2, and inert gases such as helium. Distributed fluid expulsion at the sea floor also occurs via fracture networks and faults through the upper plate, and from compaction of the accretionary wedge. All these fluid expulsion processes contribute significant volumes of dissolved solids to the oceans.
A notable feature of volcanic arcs is their restriction to relatively narrow, linear regions of the upper plate. This implies some kind of mechanism that focuses both aqueous fluid flow and rising magmas; for example, fault and fracture networks, permeability channels, or the channelling of buoyant fluids via temperate gradients or changes in crustal rheology (e.g., Wilson at al. 2014; PDF available).
Other posts in this series
Sedimentary basins: Regions of prolonged subsidence
The rheology of the lithosphere
Isostasy: A lithospheric balancing act
The thermal structure of the lithosphere
Classification of sedimentary basins
Stretching the lithosphere: Rift basins
Nascent, conjugate passive margins
Thrust faults: Some common terminology
Basins formed by lithospheric flexure
Basins formed by strike-slip tectonics
Allochthonous terranes: suspect and exotic
Source to sink: Sediment routing systems
