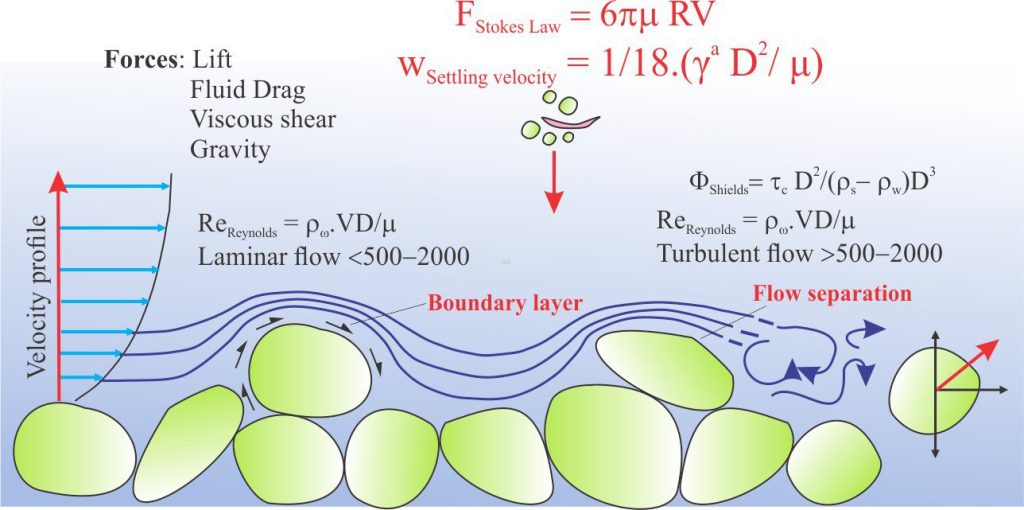
Stokes Law and the terminal or settling velocity of particles in suspension
The experiments conducted by Shields and Hjulström examined the conditions required to get sedimentary particles moving in a flowing fluid. Their diagrams express initial grain movement in terms of the shear stress imposed on clasts by the flowing fluid – laminar or turbulent flow, flow velocity, and particle size. From a depositional perspective, most granular sediment is deposited during bedload transport or from suspension. Sediment entrained as bedload remains on the sediment bed and is moved as a traction carpet and by saltation where clasts are suspended in the fluid for very brief periods (usually measured in seconds).
Deposition of sediment from suspension requires a different set of circumstances. Suspended sediment loads usually consist of clay, silt, and very fine sand-sized particles (including bioclasts) that are supported by fluid turbulence within the water column over relatively long periods of time (days, months, centuries). The volume of suspended sediment in a water column depends mainly on:
- The availability of fine-grained particles.
- Flow velocity and magnitude of the shear stress across the sediment bed. In general, the greater the shear stress, the higher the concentration of suspended sediment.
Sediment must fall out of suspension for deposition to occur. The rate at which sediment falls depends on factors such as:
- Fluid viscosity.
- Particle size, shape, and its submerged specific weight.
- Whether particles have negative, positive, or neutral buoyancy (negative buoyancy is required for particles to fall).
- The degree of turbulence.
- Any chemical changes that alter particle size and shape while suspended. For example, gradual dissolution of aragonite and calcite particles at oceanic depths below their respective compensation depths, will reduce their size and specific weights.
- The formation of colloids, particularly with clays.
The impact of variable sediment fall rates on deposition is nicely illustrated by J.R.L. Allen (1992 edition). Back of the envelope calculations of fall rates for quartz grains of various sizes settling through an ocean water column 4 km deep show that sand size grains will settle in a few days, silt grains in about a year, and clay particles about 100 years. Because ocean water masses flow, the clays could potentially travel several thousand kilometres from source before coming to rest on the sea floor.
How are these calculations made? This is where Stokes Law and the concept of terminal fall or settling velocity apply.
The forces acting on a falling particle
Particles that fall through a viscous fluid will experience two main forces: gravity and opposing frictional forces that are a function of viscosity – also called drag forces. During the early stage of settling, particles will accelerate because the gravitational force is greater than viscous drag forces. However, at a certain velocity, the submerged weight of the particle equals the drag force and acceleration ceases; the particle continues to fall at a constant speed, or terminal velocity. Knowing the terminal (settling) velocity for particles of different size and density, in fluids of different viscosity, is particularly useful because it allows us to calculate the time taken for settling (also knowing the fluid depth). Such calculations apply to sediment in suspension in rivers, lakes, and oceans, and to volcanic ash and aerosols that have been lofted airward. The converse also applies; if we know the terminal velocity, the fluid viscosity can be back-calculated – this is particularly useful for determining the viscosity of turbulent plumes like those involved with volcaniclastic airfall and pyroclastic density currents. The problem here is that we need quantitative data on the drag forces. This problem was solved by George Stokes in 1851 who published a solution to the problem in a Transactions of the Cambridge Philosophical Society paper ‘On the effect of the internal friction of fluids on the motion of pendulums’ (PDF available).
Stokes Law
Stokes approached the problem of viscous drag by simplifying the particle-fluid system. He assumed particles were spherical – important because it is easy to calculate particle surface area, and because particle shape and surface area do not change if the particle rotates. Stokes analysis requires laminar flow with Reynolds Numbers <1 (this avoids the problem of turbulence). Particle spheres must also be smooth to avoid abrupt changes in boundary shear stress. This particle-fluid system can be demonstrated experimentally using viscous oils, such as glycerine, where coloured dyes can be added to observe the course of flowlines around the particles. Have a look at John Southard’s (updated 2021) and J.R.L. Allen’s summaries if you would like an explanation of the fairly complicated maths involved in the derivation of Stokes Law.
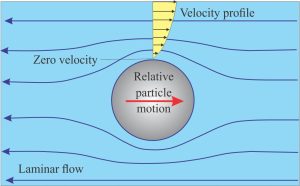
Stokes Law expresses the fluid drag Fd as:
Fd = 6πμVR where
μ is viscosity, V is mean velocity, and R is particle radius (the equation is often written as Fd = 3πμVD where D is particle diameter).
Calculating settling velocity
Settling velocity (ws) occurs at the point where the submerged weight of the particle equals the drag force.
The submerged (immersed) weight = Weight of particle – buoyancy force.
Buoyancy force equals the weight of the displaced fluid (Archimedes’ Principle). In our case, the volume of displaced fluid is the volume of the spherical particle. Thus, the submerged weight is written as:
(1/6)πD3γ where γ is the submerged weight per unit volume calculated from the expression γ = (ρs – ρw)g where ρ is the density of the solid grains and water respectively. Therefore, the equality is written as:
(1/6)πD3γ = 3πμVD such that the settling velocity ws for Re <1 is
ws = 1/18. (γ D2/ μ), or if you prefer
ws = 1/18. (ρs – ρw)g D2 /μ
Flow dynamics at higher Reynolds Numbers
Stokes Law applies only to particles that are very fine-grained sand sized and finer, and at low Reynolds numbers such that laminar flow persists during settling. The dynamics of flow around a falling particle change significantly at higher Re values – this applies to particles of all shapes. Two conditions are worth considering from a sedimentological perspective: flow separation, and the motion of settling particles.
Flow boundaries
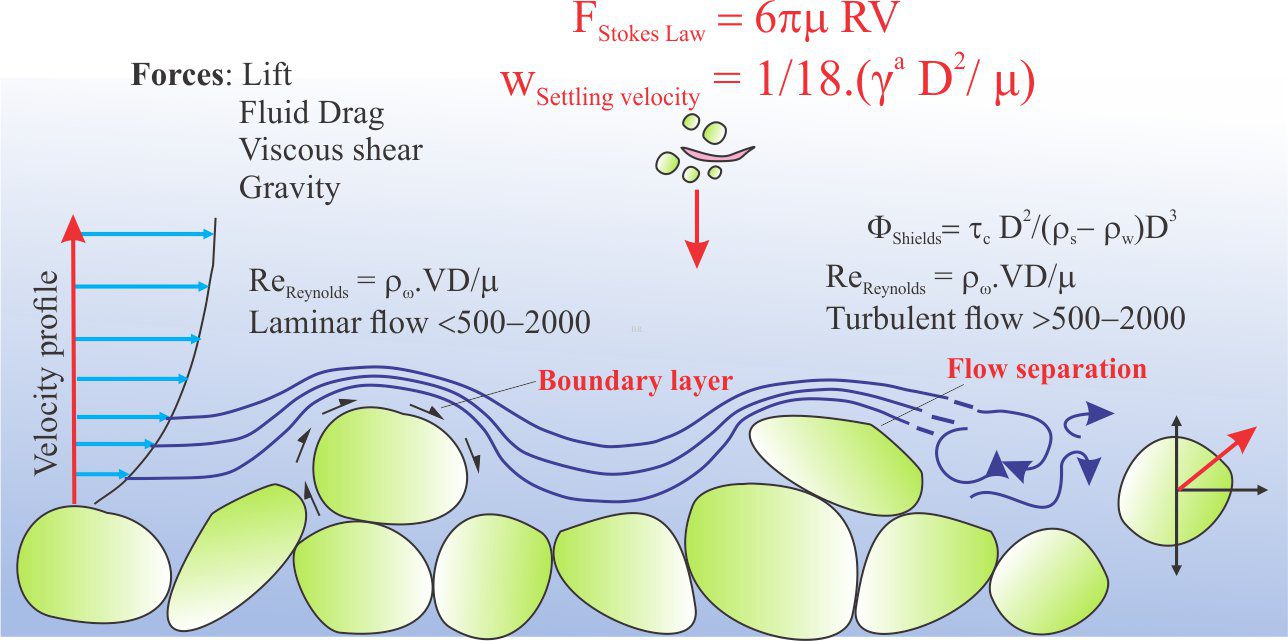
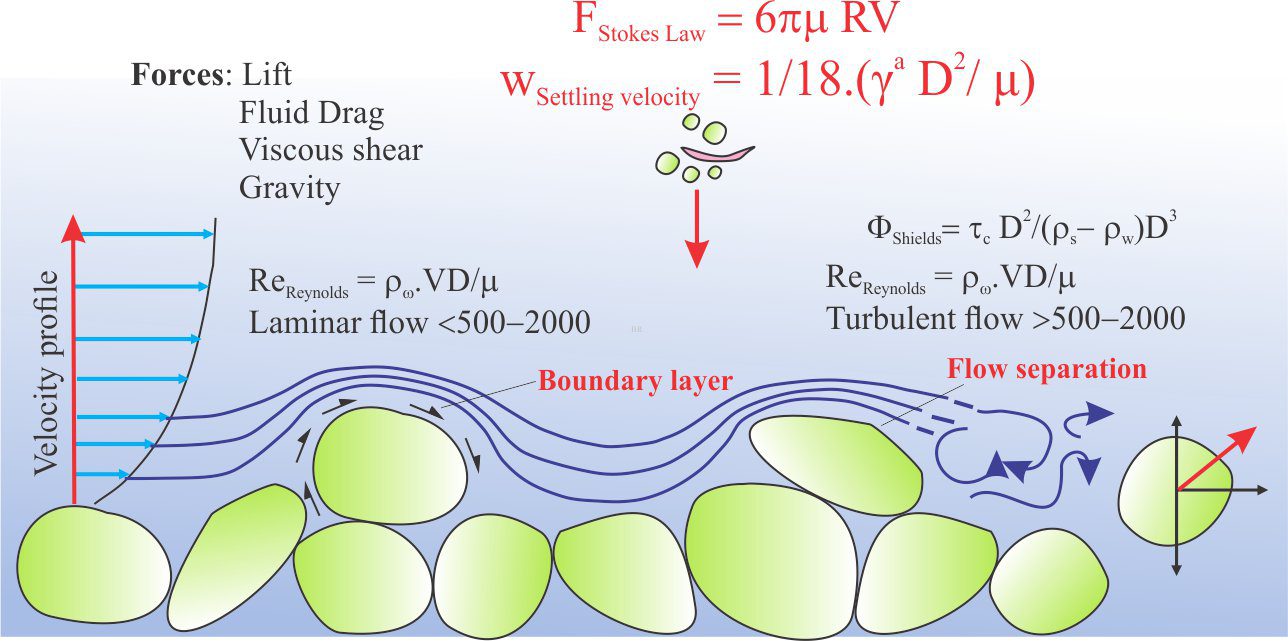
The contact between a flowing fluid and a solid surface is defined by a boundary layer where friction forces reduce flow velocity to zero. The contact is commonly called a no slip, or zero shear stress boundary. Friction along the boundary is primarily a function of fluid viscosity and surface roughness. A velocity profile through the boundary layer shows a gradual increase in velocity to the point where free stream flow prevails.
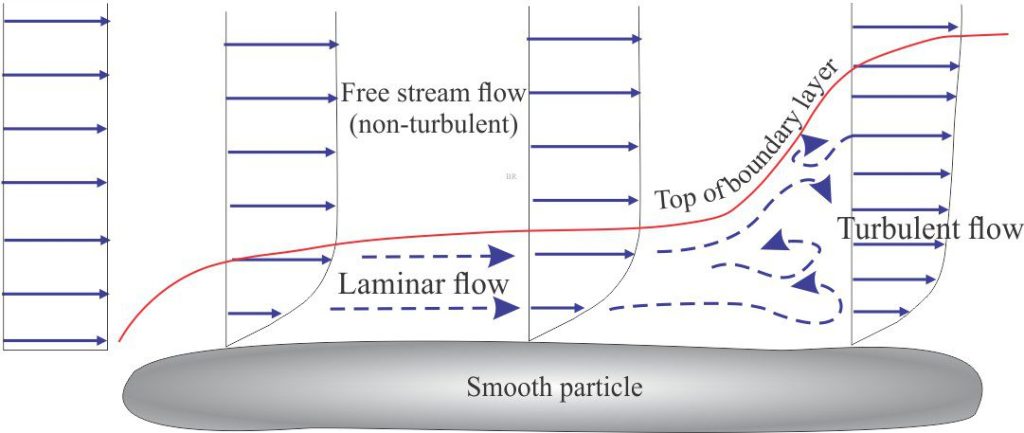
An approximation of the boundary layer thickness Tb can be written as:
Tb = L/Re1/2 where L is the length of flow contact at the boundary – in most sedimentary particles this will be very small. Tb is inversely proportional to the square root of the Reynolds Number for flow. Thus, as Re increases, the boundary layer thickness decreases. This makes sense if we recall that for large Re values, inertial forces basically suppress viscous forces.
Boundary layers can also be defined as laminar or turbulent. A laminar boundary layer contains roughly parallel streamlines; turbulent boundary layers contain small eddies and swirls. Turbulence within the boundary layer depends on the Reynolds Number and solid surface roughness. Turbulent boundaries develop greater drag forces and are thicker than laminar flow boundaries.
Flow separation
At low Re values (laminar flow) parallel streamlines, or flowlines are deflected by a particle; they converge towards the top of the particle and diverge back to parallelism on the downflow side (Stokes Law conditions apply). In this case the boundary layer remains attached to the particle surface.
As Re values increase, the boundary layer detaches from the particle surface at a point where the solid surface curves away from the direction of flow; the boundary layer is no longer attached on the downflow side of the particle. This is referred to as flow separation. Flow in the region of separation is characterised by degrees of turbulence that increase with increasing Re values. A cartoon of this progression is shown below.
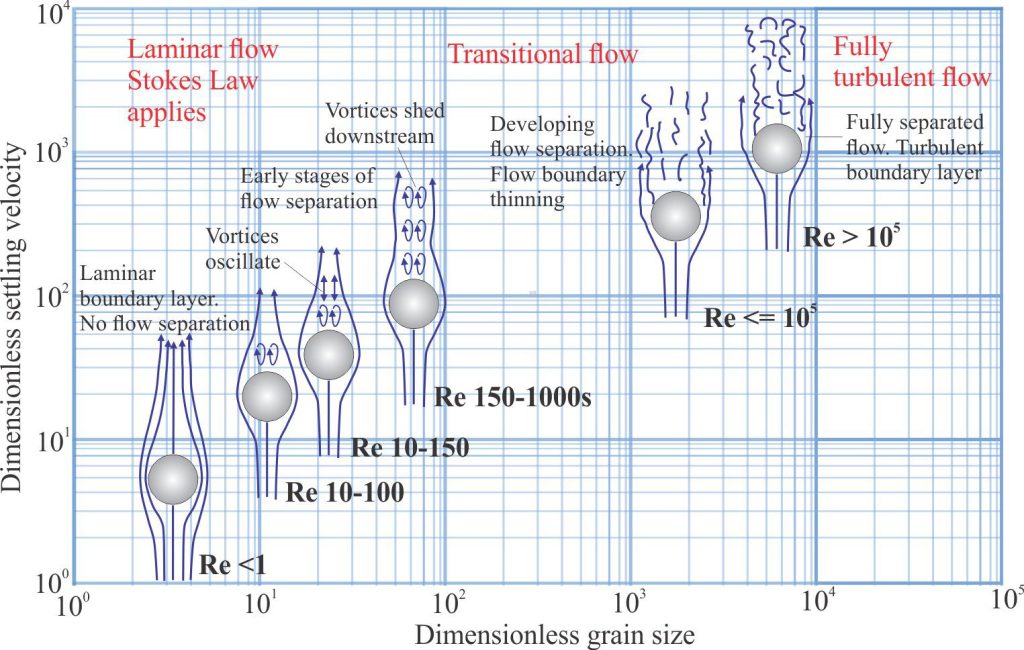
Flow separation occurs at scales ranging from single grains, to tumbling accretionary lapilli in an eruption ash column, and bedforms that migrate under unidirectional flow. One familiar example of larger scale flow separation is developed beyond the crest of current ripples and dunes, where flow across the stoss face exits the crest leaving a region of lower pressure eddies and backflow across the lee face.
Particle motion during settling
When considering the settling of particles through water bodies such as lakes and oceans we generally assume the water mass to have little or no lateral flow (unlike that of a river). In this case, we represent flow lines around a settling body as moving upward relative to the falling motion of the object. In reality, most objects falling out of suspension are non-spherical. For sedimentologists this includes clay and silt-sized particles of varying compositions that generally obey Stokes Law conditions – carbonate, siliciclastic, clays, volcanic ash, tektites, plastic. In the carbonate realm the objects of primary interest include carbonate mud and micro-organisms such as foraminifera and coccoliths. Common siliceous micro-organisms of interest are diatoms and radiolaria. All these objects have highly variable shapes, sizes, and submerged specific weights that will influence their terminal fall velocities.
Multiple experiments using settling tubes have demonstrated that the falling motion and velocity for variously shaped objects (discs, cylinders, oblate spheroids, and concavo-convex bivalve shells) is influenced by Reynolds Number as well as textural properties such as shape and surface roughness. The motion of objects is frequently described as steady at low Re values, and tumbling (rotating) or oscillating (moving from side to side) at higher Re.
Disarticulated, concavo-convex bivalve shells have received some attention in this regard. For example, compare the settling velocities for several bivalve genera with that for spherical glass beads presented by Rieux et al., 2019 (their Figure 6). Their experiments included whole and fragmented shells. The range of settling velocities is strongly dependent on shell or fragment shape (particularly convexity), and internal shell structure (layering) that creates edge effects on broken shells.
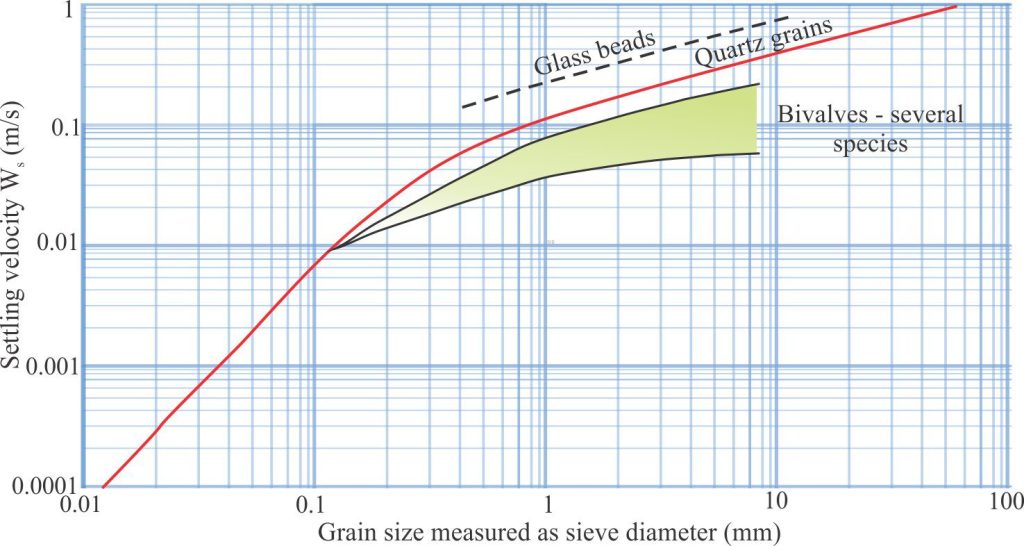
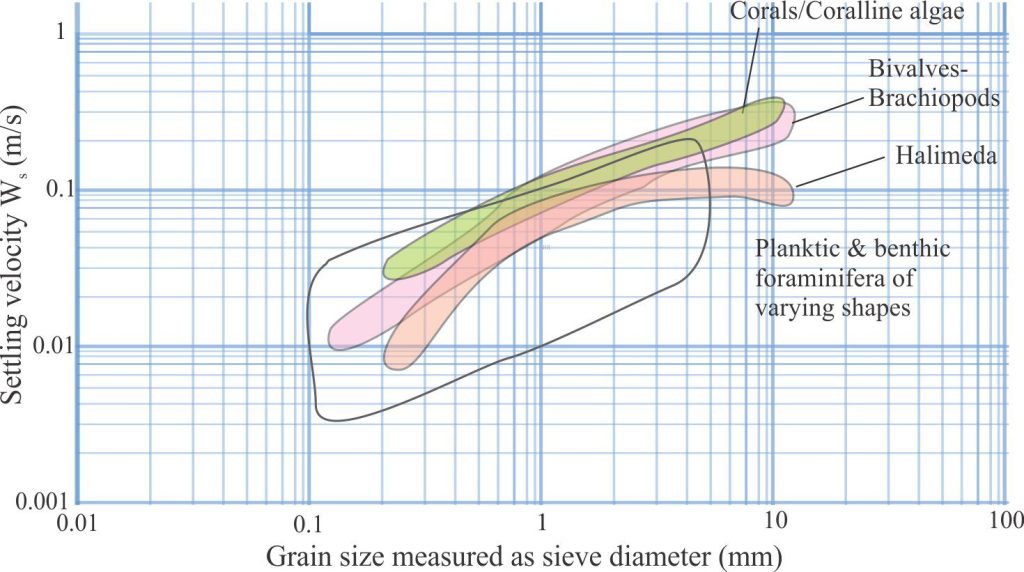
A comprehensive review of the settling characteristics of carbonate grains, particularly bioclasts, is presented by de Kruif et al., 2021. Their review collates a lot of data on particle density, shape, and size across the phyla commonly involved in carbonate production. Some of the data is summarised below in a modified version of their Figures 12 and 13.
This post is a companion to:
The hydraulics of sedimentation: Flow Regime
Sediment transport: Bedload and suspension load
