Getting sedimentary grains moving in a flowing medium
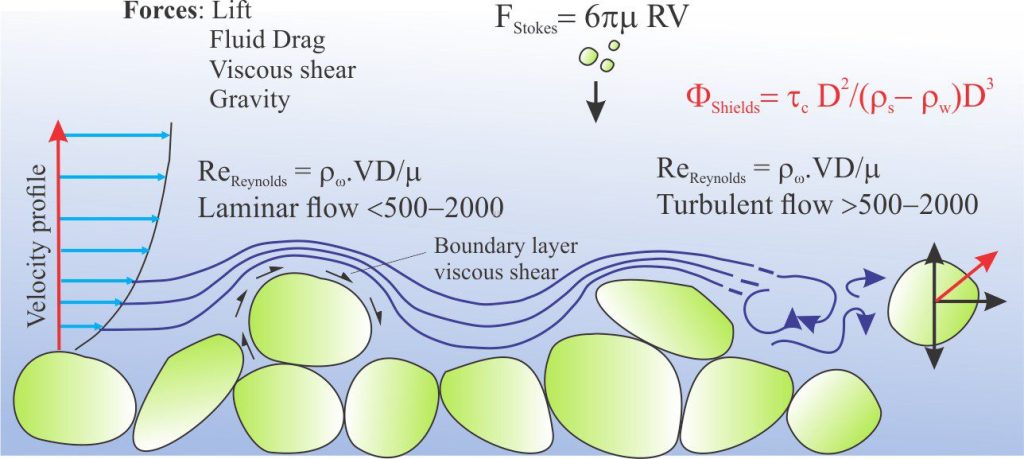
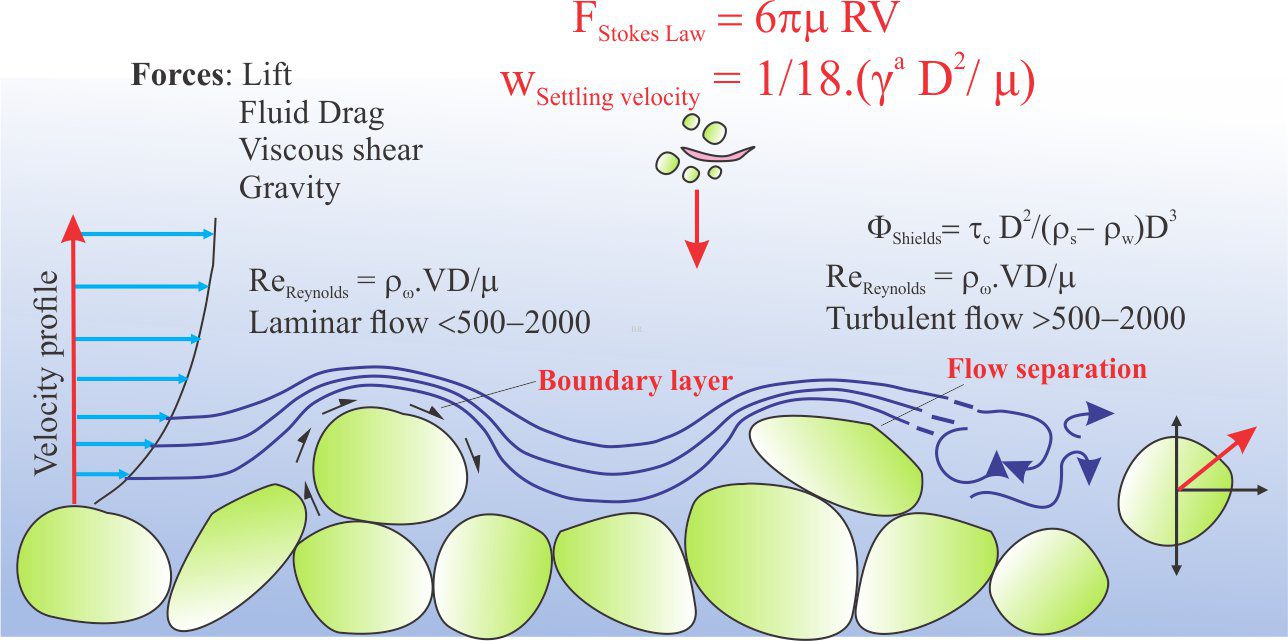
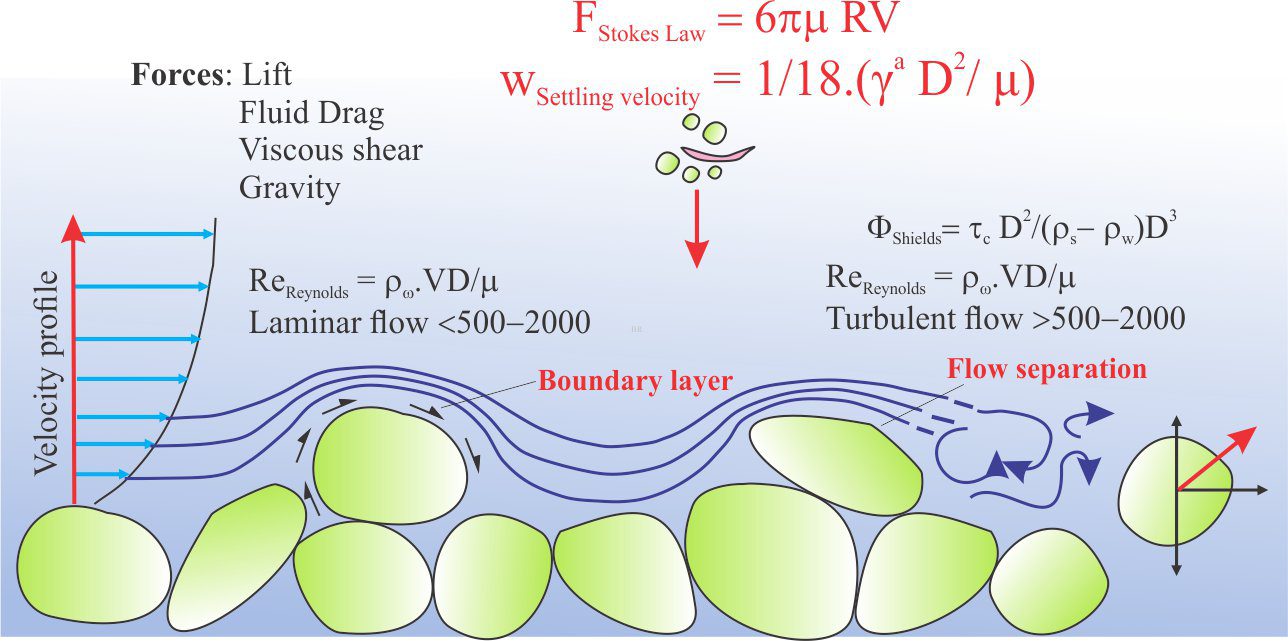
Formation of granular sedimentary layers and many of the bedforms within requires movement of grains from one location to some other location, as bedload or suspended load. Initiation and maintenance of grain movement in a fluid (air or water) requires that the shear stress derived from the flowing fluid must overcome the opposing gravitational, viscous, and friction forces acting on each grain. The critical or threshold shear stress is that where grain movement begins.
An understanding of the conditions required to initiate grain movement is important for engineering problems involving fluid flow, such as the stability of bridge abutments in rivers, and for sedimentological interpretations of ancient environments. Questions like “What flow conditions were required to move the range of clast sizes in a pebbly sandstone” are central to sedimentary facies analysis.
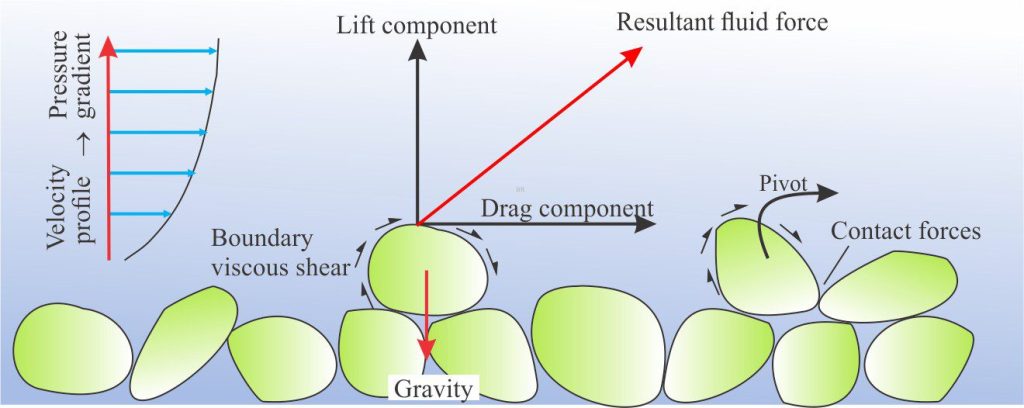
The definition of initial grain movement is not as straight forward as it first appears. Does the threshold shear stress (or critical flow velocity) for grains on a sediment bed correspond to an initial nudge, or does the grain need to travel one or more revolutions of its circumference? In most natural sediment beds there is a range of grain sizes so which grain threshold stress applies – that responsible for movement of the coarsest, the mean, or median grain size? John Southard has given us an excellent summary of this problem.
Two graphical representations of these threshold conditions stand out; the iconic Shields and Hjulström diagrams. Both are empirical constructions derived from experimental data; both were developed in the 1930s – the original and modified forms of these diagrams are still used widely.
Shields diagram
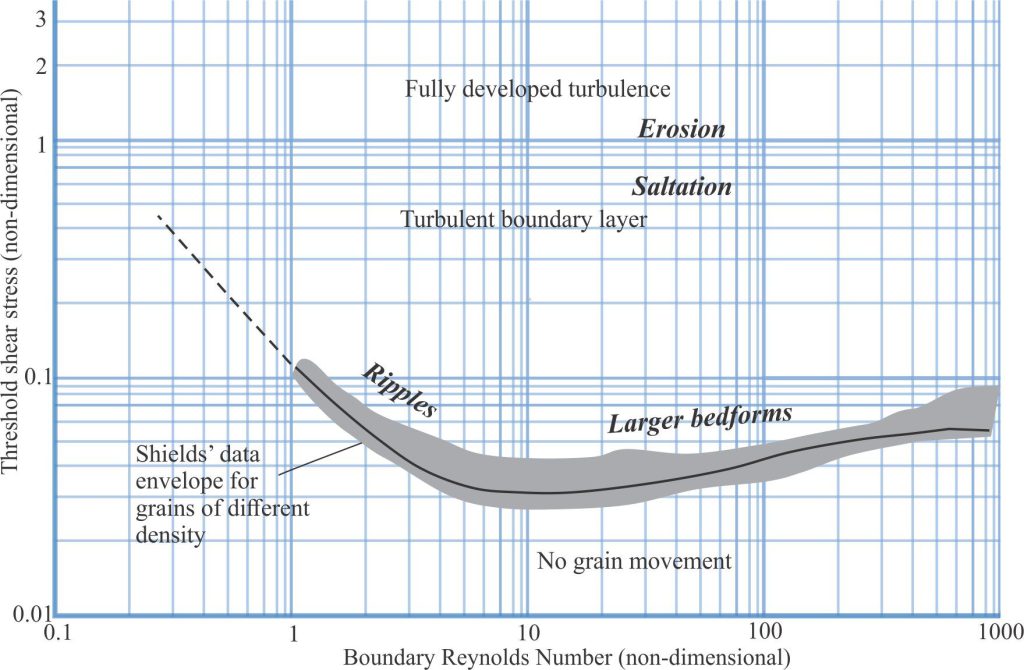
Albert Frank Shields (1908 – 1974) was an American engineer whose experiments on the transport of granular sediment led to the formulation of the eponymous Shields Parameter (Θ) that expresses the shear stress (τ) required to initiate grain movement. The flume experiments were actually conducted in 1930s Germany and published in 1936 (Application of similarity principles and turbulence research to bed-load movement). The Shields diagram plots (Θ) against the Reynolds Number that describes the hydraulic conditions across the grain boundary. The original diagram specifies two fundamental domains: One of grain movement, the other where the threshold shear stress is not high enough to initiate movement. His experiments used grains of different densities – amber, lignite, granite, barite, and sand.
The Shields Parameter Θ can be written as:
Θ = τc.D2/(ρs – ρw)gD3
where τc = critical stress at the grain boundary; D = mean grain diameter, and ρ the density of the solid grains and water respectively. The value (ρs – ρw)g is the submerged specific weight of a grain. The numerator τc.D2 is proportional to the fluid force acting on a grain; the denominator (ρs – ρw)gD3 is proportional to the weight of the grains. Θ is dimensionless because the shear stress (i.e., the pressure exerted on a grain) can be written as τ = ρw.gz (also the general form of the equation used to calculate hydrostatic and lithostatic pressures), where z is a characteristic depth or thickness and has the same units as grain diameter.
The Shields diagram plots (Θ) against the grain Reynolds Number. Use of the Reynolds Number (Re) is important because it relates inertial forces and dynamic fluid viscosity to the two fundamental types of flow – laminar and turbulent.
Re = ρw VD/μ
where V the mean velocity reflects shear rate and inertia forces, and μ is fluid viscosity that measures the resistance to shear. Re is dimensionless. In Reynolds’ original experiments D was the flow tube diameter; in the Shields diagram it corresponds to mean grain diameter. Thus, at low Re values viscous forces suppress turbulence and the flow is laminar. At high Re values inertial forces exceed viscous forces and flow is turbulent.
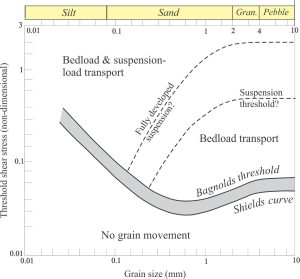
There have been several replottings, modifications, and recastings of Shields’ 1936 diagram. R.A. Bagnold (PDF available) published a US Geological Survey Report in 1966 where he considered the initiation of grain movement and the maintenance of a suspension load for finer-grained particles that incorporates Shields’ criteria. His entrainment diagram (his Figure 8) plots the non-dimensional threshold shear stress against (dimensional) grain diameter.
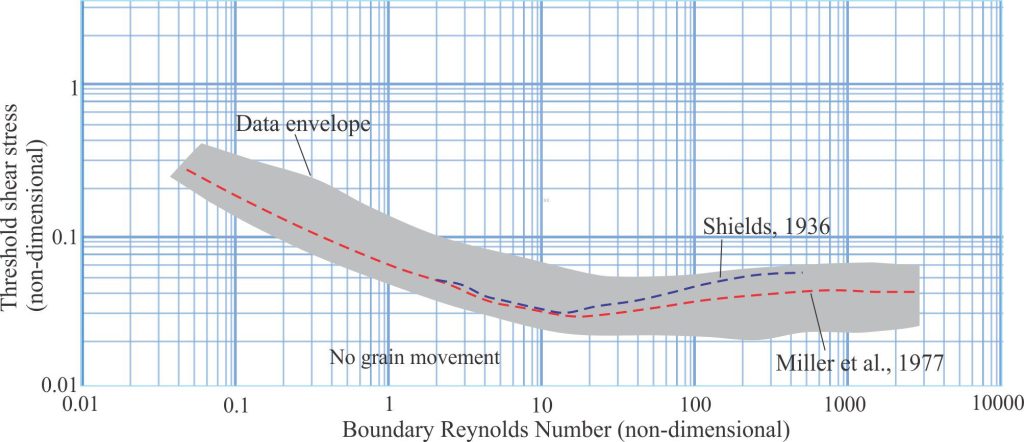
Recasting and replotting of the Shields criteria by M.C. Miller et al., 1977 is another frequently cited version. These authors extended the grain size Reynolds numbers by more than two orders of magnitude beyond those used by Shields. The non-dimensional variables are the same as in Shields’ original diagram. Their graph shows the spread of data (from various sources).
Hjulström’s diagram
Filip Hjulström’s (1902-1982) diagram is particularly useful for sedimentologists who prefer to think in terms of measurable flow velocities rather than shear stresses or shear velocities. It was published in 1939. It is still a popular reference. His diagram specifies three domains: erosion (net loss of sediment), deposition (net gain in sediment), and transport that may involve components of erosion or deposition.
[Hjulström, F. (1939). Transportation of detritus by moving water: Part 1. Transportation. In P. D. Trask (Ed.), Recent marine sediments. A Symposium: Tulsa, Oklahoma (pp. 5–31). Tulsa, OK: AAPG.]
Hjulström was a Swedish geographer who conducted experiments on flow and sediment transport for his PhD on the River Fyris. His experiments involved measuring the mean flow velocity at which grains of a specified diameter began to move; the experiments were conducted in a canal with water depth of one metre. Hjulström understood the problems of what constitutes a representative flow velocity – it can be taken as the surface flow velocity, the mean velocity over a specified depth, or more appropriately for this particular problem, the velocity at the grain boundary but this was difficult to measure (at least back in the 1939s). He chose mean velocity because it is relatively easy to measure. His experiments included a much greater range of grain sizes than those conducted by Shields – clay through cobble sizes.
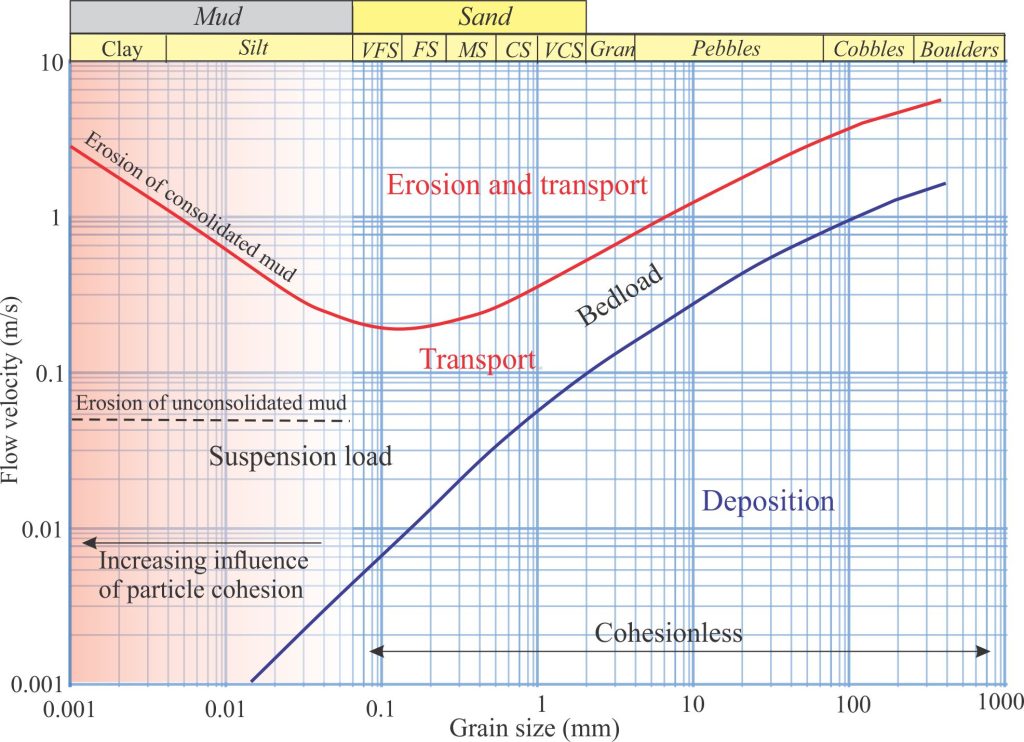
The boundaries that describe each domain are based on flow depths of one metre, and average grain density of 2.5 – 2.6 g/cm3. The boundaries will shift for different water depths and grain densities. For example, domain boundaries will tend to move upwards for carbonate-dominated sediment (grain density 2.7 – 2.8 g/cm3) because greater shear stress is required to initiate grain movement. The boundary between bedload and suspension load transport will be diffuse depending on the textural and mineralogical character of the sediment, as well as the flow characteristics (e.g., compare the hydraulic behaviour of mica flakes to that of spherical quartz grains).
The lower curve separates depositional flows from transport flows. The upper V-shaped curve reflects the increasing cohesion of finer grained particles, particularly the clay and fine silt fractions of muds. Cohesion in this case is primarily a result of the large surface area relative to particle size, plus the residual electrical charges on clay mineral surfaces. Cohesive forces are also responsible for the elevated flow velocities required to erode consolidated muds. In fact, erosion of consolidated muds commonly produces chunks, or mud rip-ups rather than individual clay-silt particles.
Reading this graph is relatively straight forward as long as you are aware of the caveats such as grain shape and density, and whether flow is laminar or turbulent. For example, for any grain diameter, follow the vertical axis to determine the flow dynamics. It is also a useful diagram to compare the flow requirements for maximum clast sizes in a deposit with the requirements for mean grain size of that deposit.
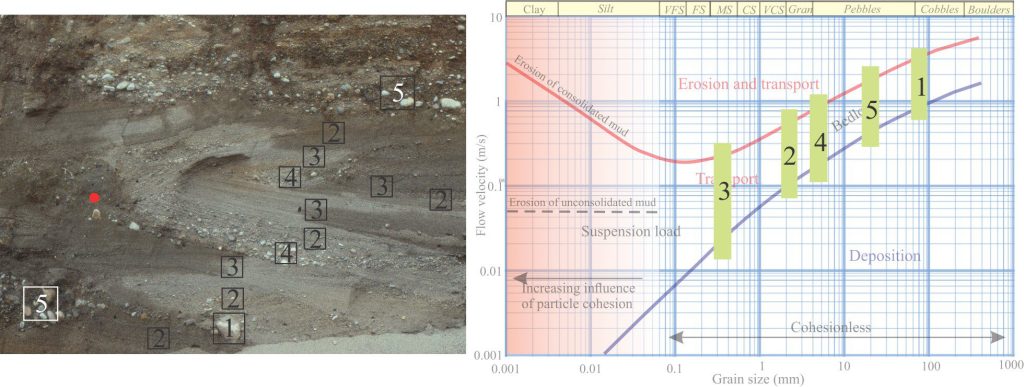
Hjulström also contributed a paper Transportation of Detritus by Moving Water to an SEPM 1955 Special Publication No. 4 ‘Recent Marine Sediments’
This post is a companion to:
The hydraulics of sedimentation: Flow Regime
Sediment transport: Bedload and suspension load
Fluid flow: Froude and Reynolds numbers
Fluid flow: Stokes Law and particle settling
Plus related posts on Stratigraphy-sedimentology
