We tend to forget that, despite the plethora of lithofacies and stratigraphic models of turbidites, submarine channels, and submarine fans, there have been very few direct observations of turbidity currents in action. The few we have been fortunate enough to capture have evaded direct measurement of the variables and processes responsible for generating and sustaining these flows – for good reason. They are unpredictable, dangerous, and inherently destructive – instruments placed in their path end up being part of the final deposits.
Our observations of their terrestrial counterparts – landslides, debris flows, and lahars are orders of magnitude more numerous – as they happen or the immediate aftermath (particularly now with readily available satellite imagery). And yet even here, our knowledge of internal processes suffers from the same fate as turbidity currents in action. The situation with pyroclastic flows is even more complicated – no one wants to be anywhere near them when they happen.
It’s fair to say that the era of sediment gravity flow experimentation began with Kuenen’s earliest flume models. His 1937 experiments were designed to demonstrate that turbulent, bottom-hugging sediment gravity flows actually existed, that they were capable of transporting sediment water mixtures that were denser than the ambient fluid in which they operated, were capable of substrate erosion, and could be at least partly responsible for erosion of submarine canyons (testing Daly’s 1936 hypothesis). Kuenen’s later experiments with Migliorini in 1950 were designed to test a hypothesis concerning the deposition of graded bedding. All these experiments were successful, perhaps “unreasonably” so (see Paola et al., 2009, 2011) given they were not deliberately scaled to any variable or process known at that time.
Experiments conducted since those early iconic investigations have given us insight into some of the conditions and processes intrinsic to turbidity currents – triggering mechanisms, viscosity and density distribution, flow dilution, runout, flow and spillover from submarine channels, conditions such as supercritical versus subcritical flow, sedimentary facies, and the broader stratigraphic implications for growth of submarine fans in relation to sediment supply and relative sea level. Most of these experiments have been scaled to natural systems (also referred to here as prototypes).
Spoilt for choice, I précis three examples that illustrate the range of investigative creativity and rigour. Each example represents part of an investigative program of experiments, conducted by the authors, that deal with different aspects of turbidity current genesis:
- Self-accelerating flows.
- Interaction between turbidity currents and muddy substrates.
- Interaction between turbidity currents and contour currents.
The lead authors of these experimental investigations have generously provided images for this post: Octavio Sequeiros, Jaco Baas, and Elda Miramontes.
1. Self-accelerating turbidity currents (Octavio E. Sequeiros et al., 2009, 2018)
Turbidity currents flow by virtue of the gravitational potential acting on the weight of suspended sediment; flow occurs in water that itself is not flowing (unlike fluvial flow and sediment transport). They can flow basinward for 10s to 100s of kilometres. The ‘how’ and ‘why’ this happens has been one of the problems central to turbidity current and turbidite studies.
Self-acceleration (also called ignition) is the process where the current picks up and entrains sediment from the substrate. If self-acceleration operates, then it is a mechanism that will potentially increase flow momentum (by the addition of mass); it will also compensate any loss of mass via deposition (for example where heavy, coarse-grained particles drop out of suspension). A consequence of the hypothesis is that the process can increase flow velocity. The self-acceleration hypothesis is not new, but the experiments conducted by Sequeiros et al., are the first to demonstrate the possibility of such processes. The self-acceleration hypothesis is not new, but the experiments conducted by Sequeiros et al., are the first to demonstrate the possibility of such processes.
Experiment design
The 15 m long flume was 1.4 m deep with two mixing tanks at the upslope end (slope = 0.05) that could generate pulsed and continuous flow feeds, and an overflow tank at the downslope end that prevented flow ponding and reflection at the end of its run. The sediment consisted of cohesionless plastic beads having median grain sizes ranging from 0.071 to 0.129 mm and specific gravities of 1.3 and 1.5. Video cameras were located at regular locations along the flume length; flow velocities were calculated using image analysis. Siphons were located above the bed to sample suspended sediment at different times and depths within a flow (to measure the changes in sediment concentration with progress of the flow).
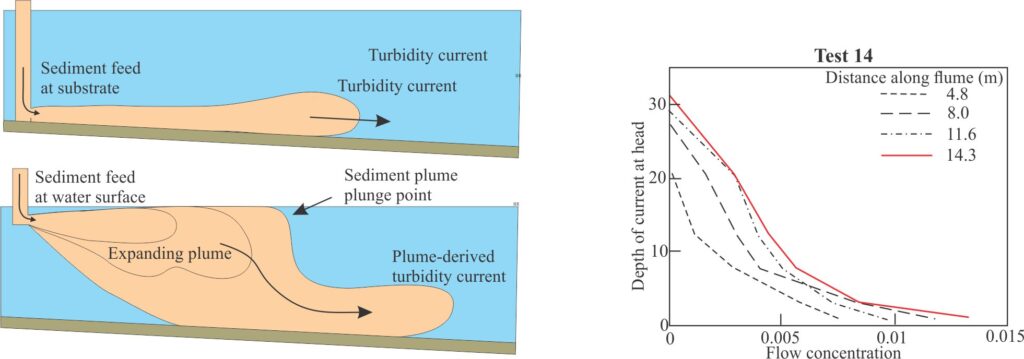
For the initial experiments the sediment slurry was introduced at the flume bed-water interface. With this release, flow velocities remained reasonably constant – there was no indication of flow acceleration. In the second set of experiments, the slurry was released close to the top water level. This produced a sediment plume that extended 1-2 m from the flume head whereupon the sediment plunged to the flume bed, initiating a bottom-hugging turbidity current (analogous to hyperpycnal flows).
Three different types of flow were identified based on measurements of suspended sediment concentrations, velocities, and depositional grain size trends:
- Flows that decelerate because of net deposition.
- Bypass flows where there is no net deposition.
- Self-accelerating flows where both velocities and sediment concentrations increase during flow.
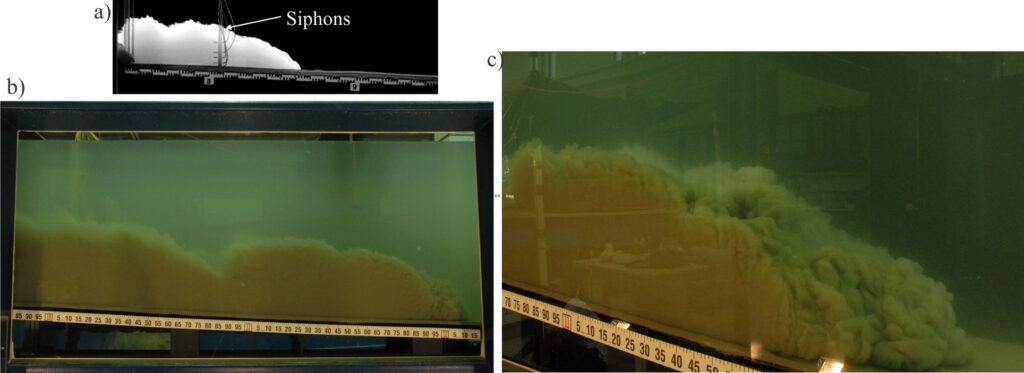
As anticipated, most of the experimental flows (except the bypass flows) show overall downstream fining trends, confirming:
- The condition that flow carrying capacity generally decreases with distance, and
- Observations of grain size trends measured in ancient proximal and distal turbidites.
In flows produced by plunging sediment plumes there was evidence of increased velocity at the flow head beyond velocities at the point of flow initiation; the example of Test 14 is shown below. In addition, analysis of sediment concentrations in three of these experiments indicated a downstream increase in sediment concentrations. The combination of results is attributed to entrainment of particles into the flow from the flume bed (there was no other obvious source for the additional sediment other than the substrate). These were interpreted as Self-accelerating flows.
Although self-acceleration identified in three flows was associated with plunging sediment plumes, the exact relationship between the two mechanisms is unclear. It is possible that flow ignition is related to rapid deposition of the coarsest particles from the plume.
Scaling the experimental flows to natural flows is based on the similarity of their respective densiometric Froude numbers and geometries. Calculated Froude numbers of around 0.9 are similar to those estimated for natural flows. Calculated Reynolds numbers of around 20,000 indicate fully turbulent conditions (similarity scaling is not possible). Sequeiros et al., apply a scaling factor of 150, which results in estimates for natural flow head thicknesses on the order of 30 m, head velocities of 2 m/s, and a characteristic suspended sediment grain size of 0.33 mm (medium sand).
2.Turbidity current interactions with muddy substrates (Baas et al., 2014; 2016)
A common attribute of ancient turbidites, particularly those interpreted as proximal, is the inclusion of muddy clasts ripped from the substrate, clasts ranging in size from granule to large blocks. This type of deposit implies that the mud layer had a degree of consolidation that allowed fragments to remain intact, and that the shear stress generated by the incoming flow was sufficient to erode the substrate. Mud-chip or rip-up beds associated with turbidity currents are one type of deposit in a spectrum of interactions between sediment gravity flows and substrates – other interactions include:
- flow bypass (no interaction).
- Shear-stress induced soft sediment deformation (e.g., convolutions).
- Compaction-induced soft sediment deformation such as load and flame structures and fluid injection structures.
- Mixing of soft, dispersed mud particles with the incoming turbidity current.
Baas et al., investigated the interaction between turbidity currents and soft, muddy substrates. They first deposited a substrate of kaolin-water having a density range of 1016-1096 kg.m-3. This substrate was overridden by turbulent suspensions of particulate coal; initial flow densities ranged from 1002-1044 kg.m-3. The flume was 4.5 m long.

The experiments demonstrate that the reaction between substrate and flow depends on the relative magnitudes of imposed shear stress at the bed contact and the cohesive strength of the substrate mud (cohesive strength is expressed in units of stress). In these experiments, shear stress depends on velocity and flow density. At low shear stress, the substrate mud remains intact although it may deform internally. At high shear stresses and where flow densities exceeded substrate density, the lower part of the turbidity currents intruded and continued to flow within the substrate mud; Baas et al., refer to these as intrabed flows. Intrabed flows are erosional. Soft sediment deformation was ubiquitous in all the experiments, as convolutions and load structures like flames, load casts, and fluid injection pipes.
The upper part of the turbidity currents (suprabeds) continued to flow above the substrate in tandem with the intrabed portion. The intrabeds contained kaolin particles eroded from the mud mixed with coal; the suprabeds were mostly coal with little or no mud. The intrabeds and suprabeds were separated by a veneer of coaly mud.
Bass al., achieved reasonable similarity between model and flow prototype using Densiometric Froude scaling of model variables like velocity, the density of the coal suspensions, and flow depths. A comparison of flow thicknesses between model and prototype indicates an appropriate length scaling factor of 0.001; scaling laws based on length enable them to calculate ratios for other model/prototype variables. Reynolds numbers calculated separately (ie. not scaled) have values of 6000-13,000, indicating fully turbulent flow.
Their depositional model is shown below. The complete model sequence of basal scours, mud rip ups and soft sediment deformation, overlain by an intrabed, mud veneer, and sandy suprabed represents proximal locations where flow contact shear stresses are at maximum levels. Downflow deceleration and loss of momentum reduces the ability for flow within, and erosion of the muddy substrate – the flow either re-emerges from the substrate or freezes within it. The distal sequence lacks the intrabed and resembles a more typical Bouma turbidite.

3 Turbidity current – contour current interactions (Miramontes et al., 2020)
Contour currents are relatively continuous, long-lived flows that, at a first approximation parallel continental slopes and rises. Originally defined by Heezen et al., (1966), they are driven by coriolis forces and ocean density gradients. With flow speeds up to 20cm/s they can transport fine-grained sediment as bedload and suspension load and can generate ripple and dune bedforms. In contrast, turbidity currents are short lived and generally flow at high angles to submarine slopes at speeds measured in metres per second.
[B. C. Heezen, C. D. Hollister and W. F. Ruddiman, 1966. Shaping of the Continental Rise by Deep Geostrophic Contour Currents; Science, Vol. 152, p. 502-508.]
Submarine channels are commonly flanked by levees that form during turbidity current overspill or overbank flow. It is anticipated that turbidity currents will be deflected by contour currents and if that is the case then the disposition of levees should be asymmetric (with respect to the channel). Whether the levees accumulate more on the upstream or downstream channel margins relative to the contour currents is a continuing debate. Miramontes et al., experiments were designed to test this hypothesis.
The 11m long flume had a slope of 11o and a preformed channel. The channel depth was adjusted so that contour currents could interact with the turbidity currents above the channel margin. The sediment-water mixture consisted of sand with a median grain size of 0.133 mm; initial mixture concentration was 17%. Contour currents were generated by pumps located along the flume side; measured velocities were 10, 14, and 19 cm/s.
The turbidity current overspill (above the channel) was deflected downflow of the contour current. This was reflected in the architecture of the resulting deposits. Channel levees were thicker and broader on the downstream margin relative to the contour currents; overspill across the upstream margin was restricted to a narrow zone. Depositional asymmetry increased with increasing contour current velocity. Ripple-like bedforms across the downstream levees were oriented at 30o-45o to the channel margin. Under these experimental conditions the downstream channel margins were constructional and the upstream margins appear analogous to cut banks. The inference the experimenters take from these results is that lateral channel migration will tend to occur in the upstream contour current direction.
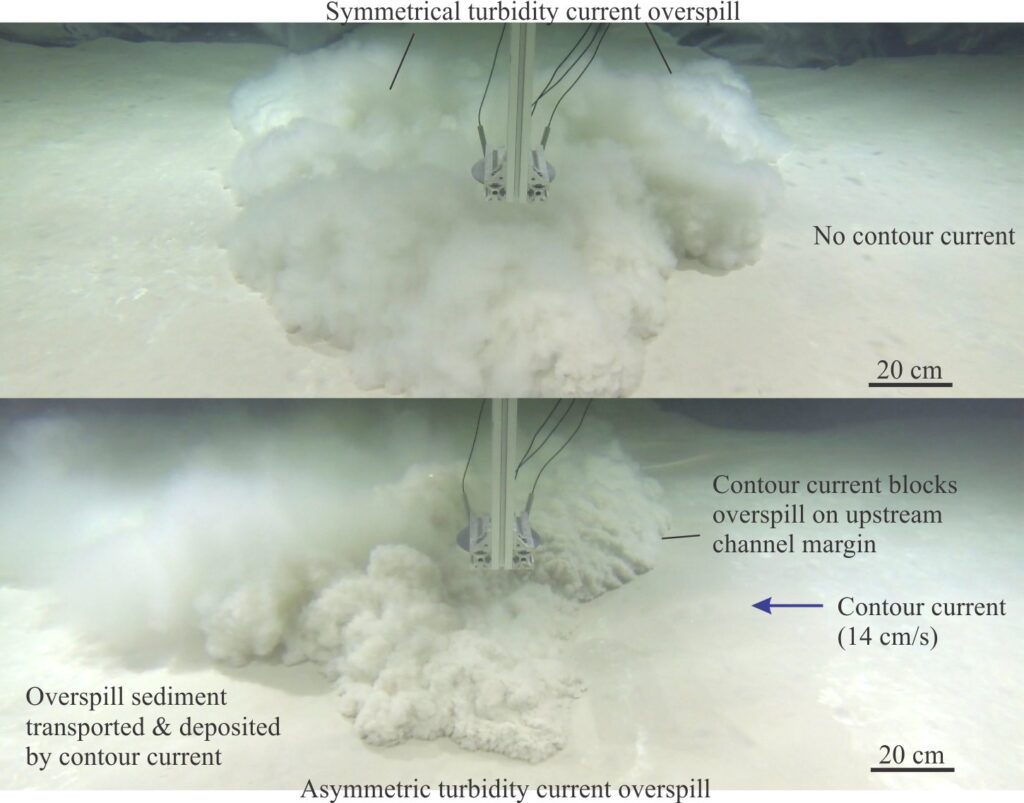
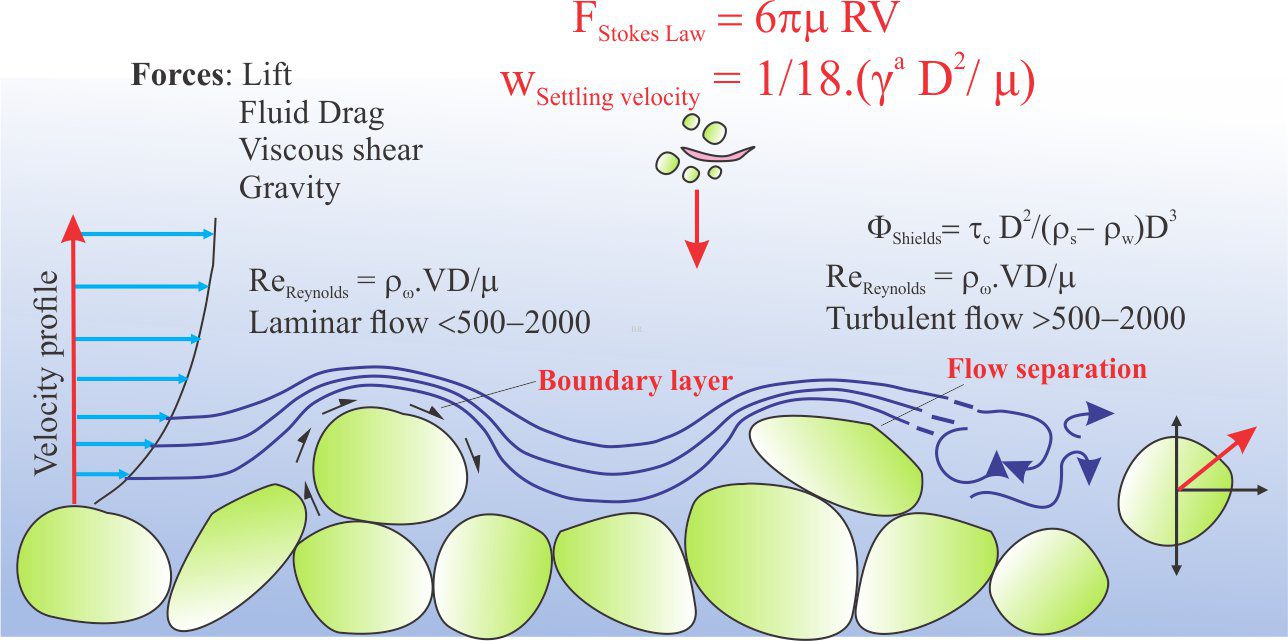
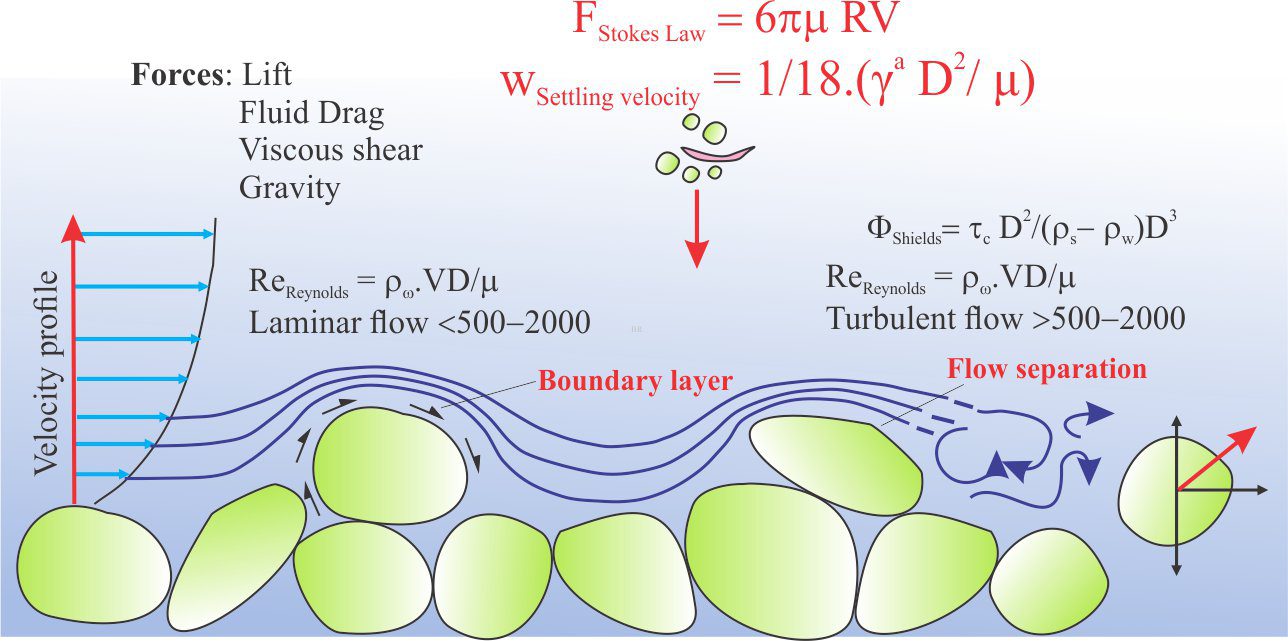
Instead of Froude scaling, Miramontes et al., downscale prototype turbidity currents to model scales using the non-dimensional Shields Parameter (φ), that describes the critical shear stress required to move sediment particles. Phi is stated in terms of the critical shear stress at a grain boundary. This also permits use of Reynolds Numbers that cannot be scaled explicitly with Froude scaling. Both quantities are dimensionless which means Miramontes et al., can achieve similarity by maintaining ratios between model and prototype settling velocities and shear stresses. They use the velocity ratio between contour current and turbidity current to scale the experiments with natural (prototype) systems, giving scale factors of 0.1 to 0.25. Thus, the experimental contour current velocities scale to prototypes at about 0.2 m/s, and the turbidity currents to 2m/s to <1m/s; both scaled results are well within measured values in natural systems.
References to the experiments
Octavio E. Sequeiros, Hajime Naruse, Noritaka Endo, Marcelo H. Garcia, and Gary Parker, 2009. Experimental study on self-accelerating turbidity currents. J. Geophysical Research, v. 114, C05025.
Octavio Sequeiros, Rodrigo L. Mosquera, Rodrigo, L. Mosquera, Francisco Pedocchi, 2011. Internal Structure of a Self-Accelerating Turbidity Current. Journal of Geophysical Research: Oceans, v. 123, p. 6260–6276. PDF.
Jaco H. Baas, Rafael Manica, Eduardo Puhl, Iris Verhagen, and Ana Luiza de O. Borges, 2014. Processes and products of turbidity currents entering soft muddy Substrates. Geology, v. 42, p. 371–374.
Jaco H. Baas, Rafael Manica, Eduardo Puhl, and Ana Luiza de O. Borges, 2016. Thresholds of intrabed flow and other interactions of turbidity currents with soft muddy substrates. Sedimentology v. 63, p. 2002–2036. OA.
Elda Miramontes, Joris T. Eggenhuisen, Ricardo Silva Jacinto, Giovanni Poneti, Florian Pohl, Alexandre Normandeau, D. Calvin Campbell, and F. Javier Hernández-Molina. 2020. Channel-levee evolution in combined contour current–turbidity current flows from flume-tank experiments. Geology, v. 48, p. 353-357.
Other posts in the turbidity current series
Experiments with turbidity currents – some historical context
