Geological-logo
Geological-logo

Evolving tempestite lithofacies models

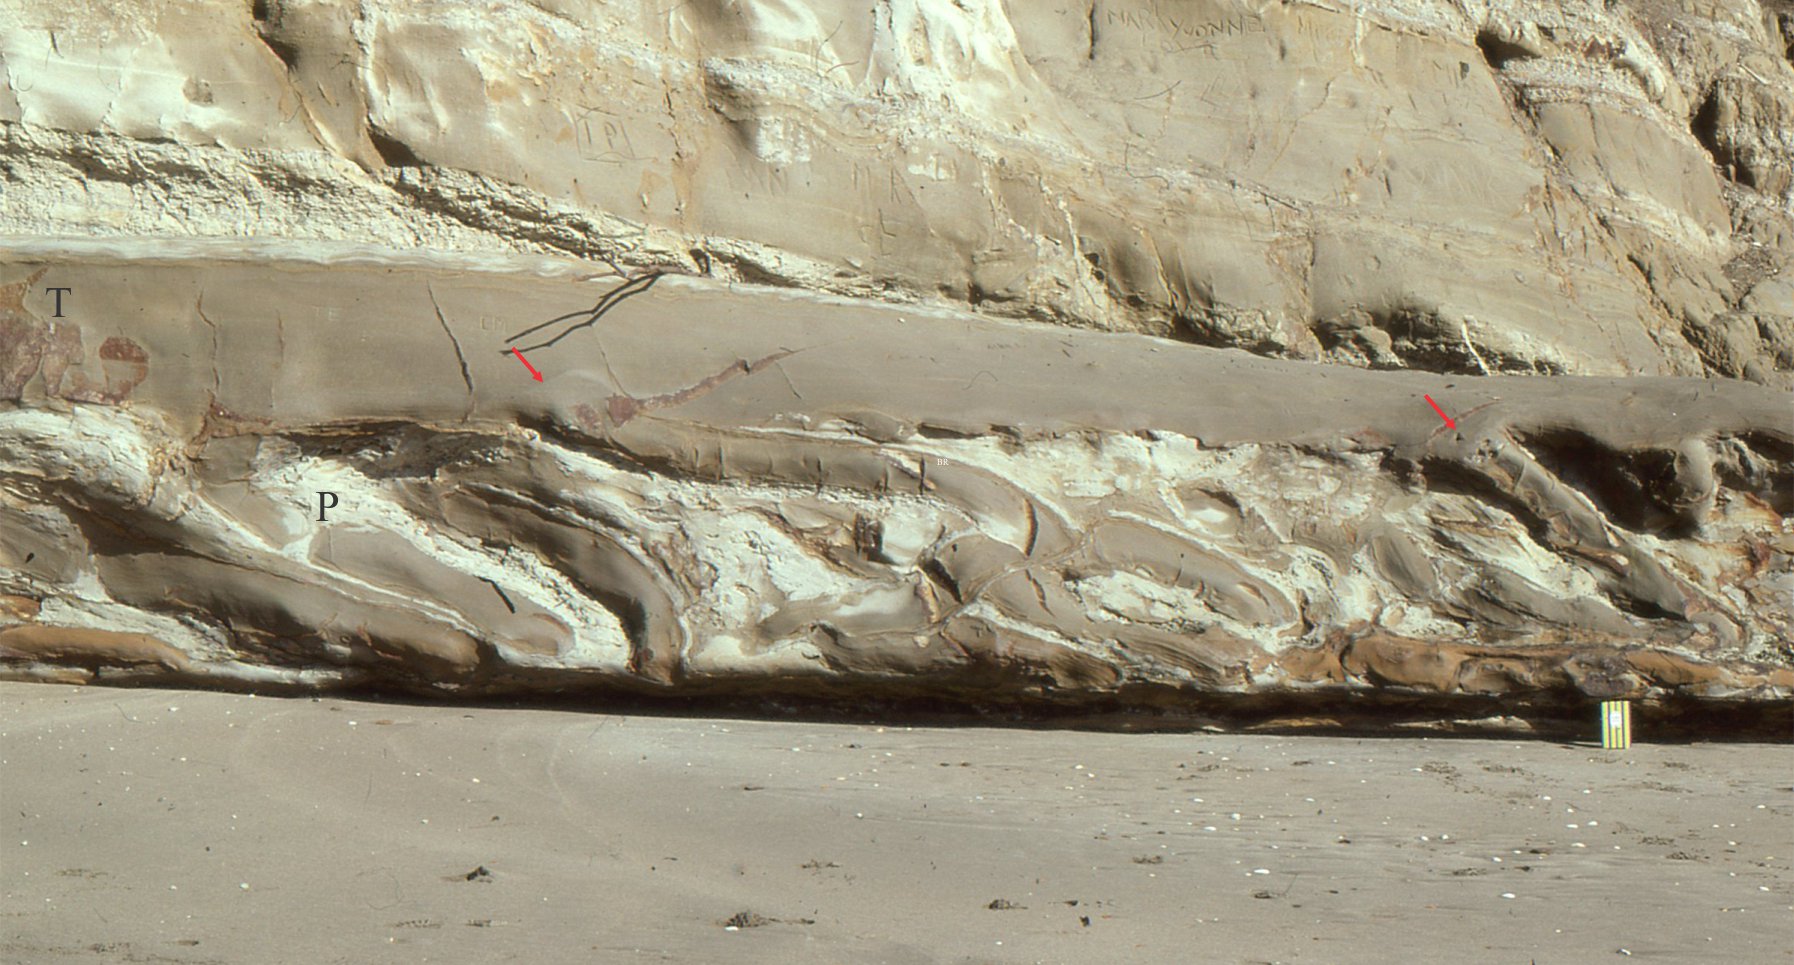
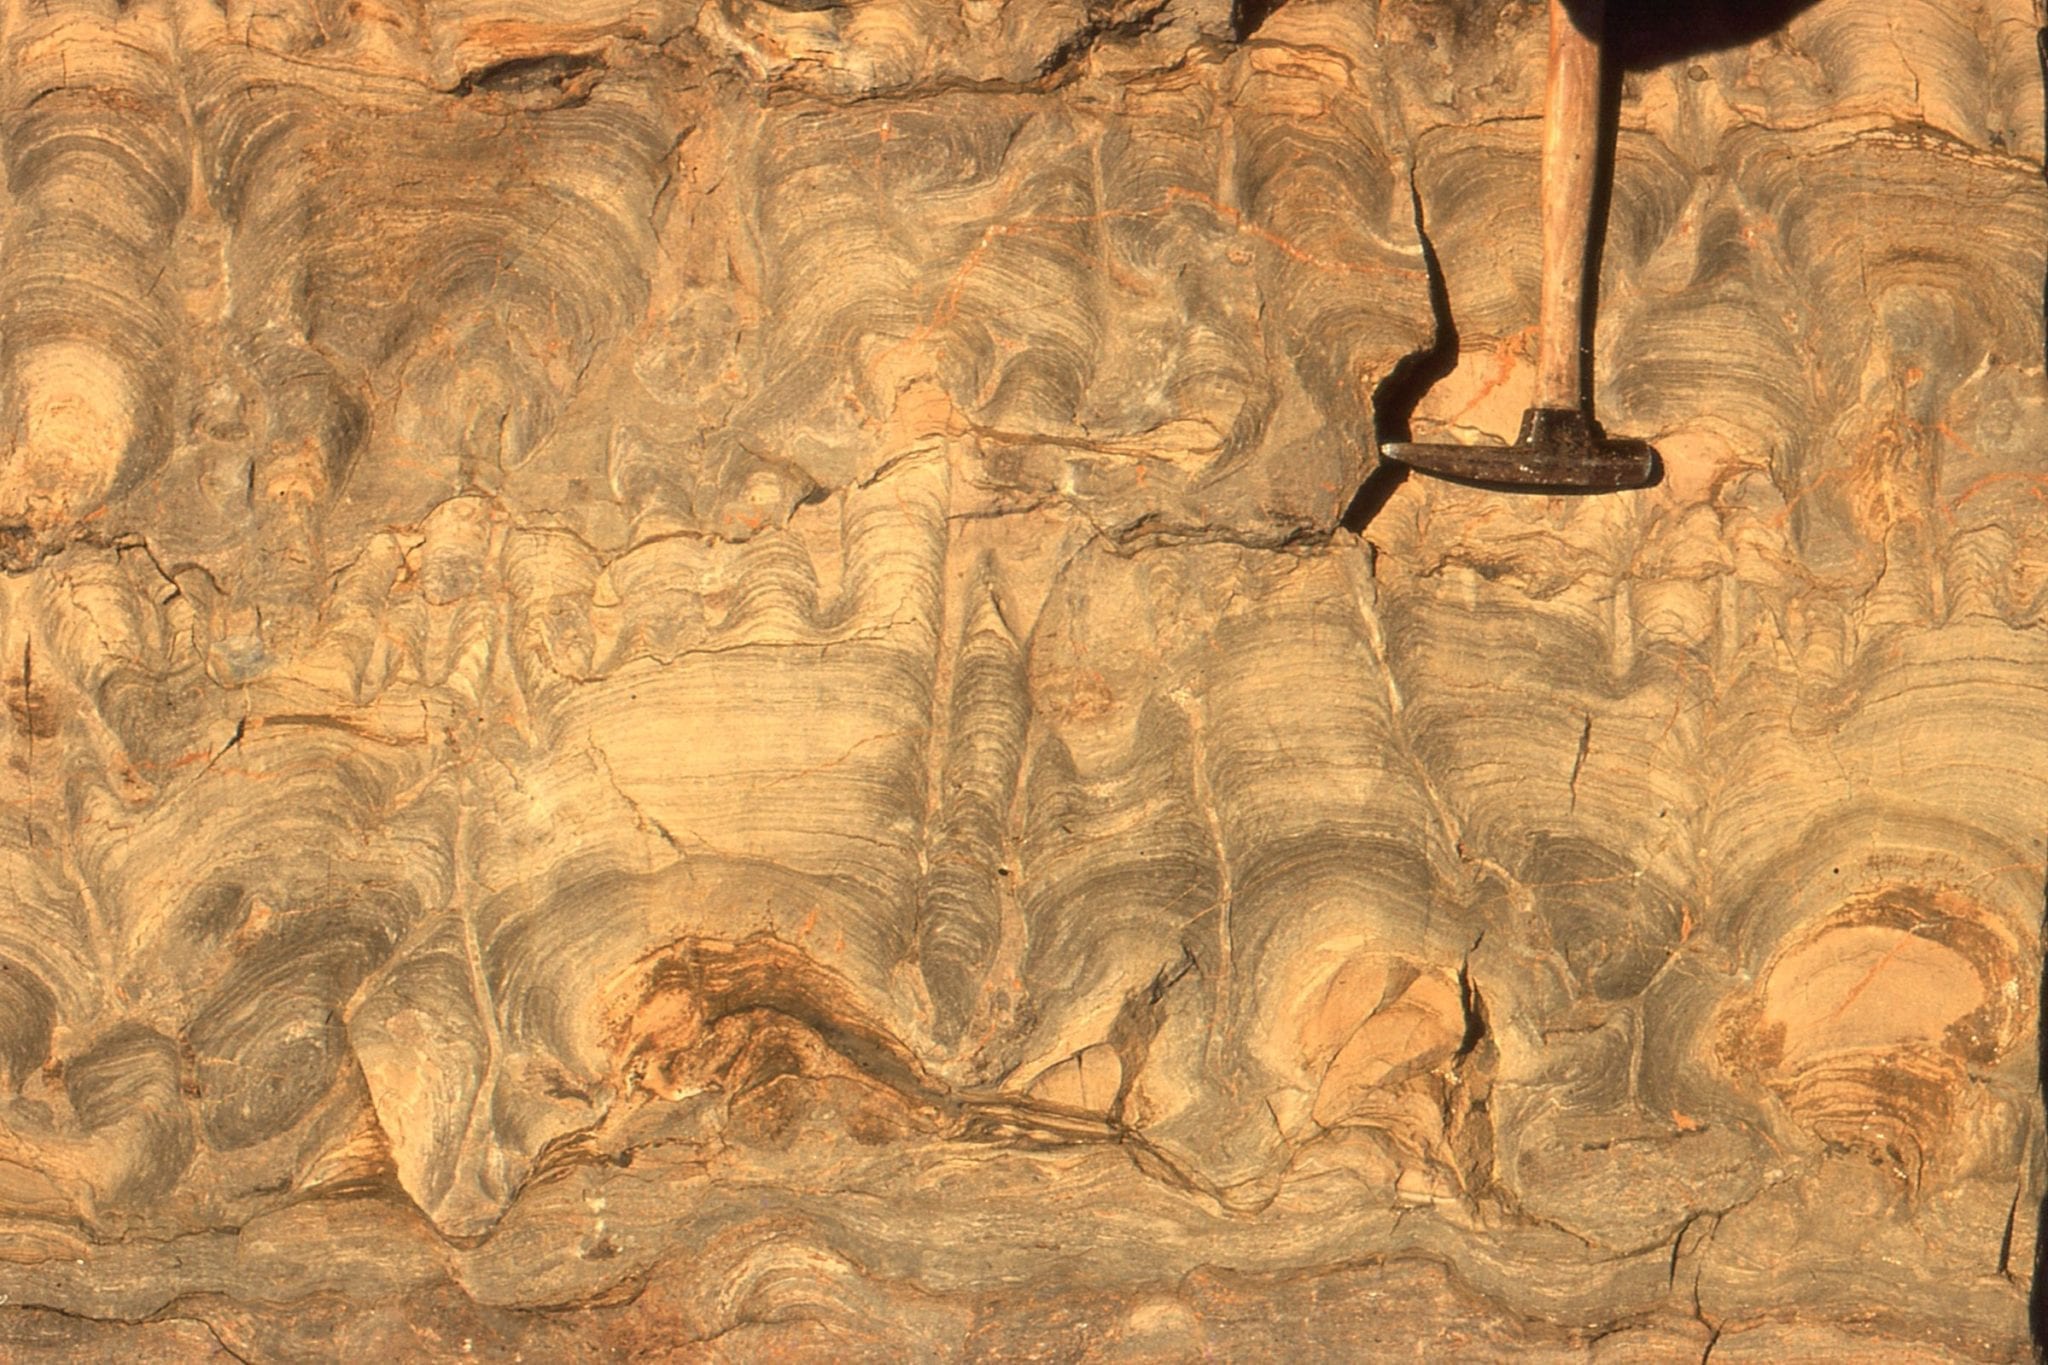
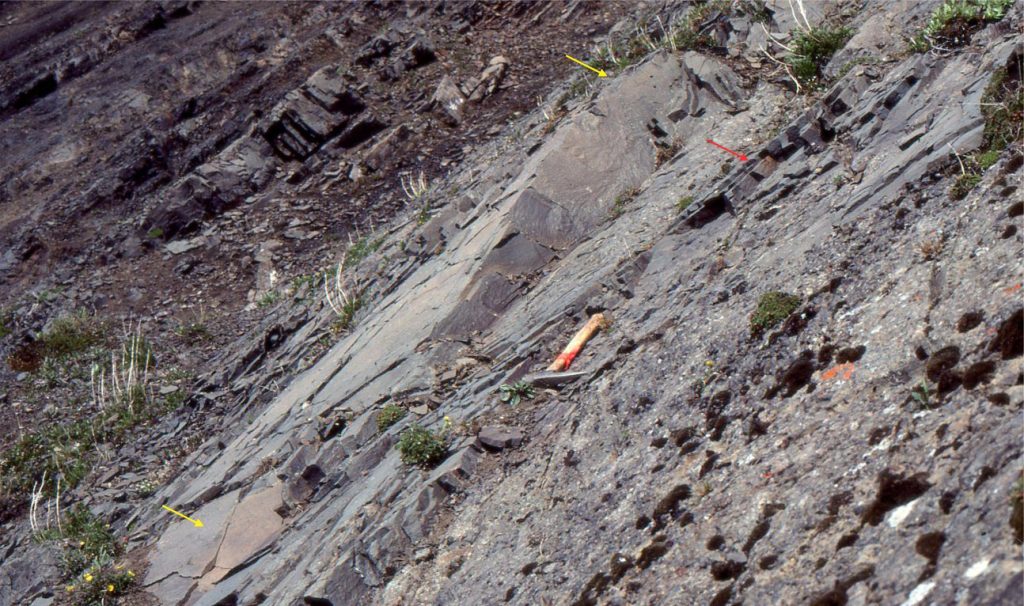
Bedding exposure of hummocks and swales (yellow arrows). Hummock amplitude is 15-20 cm and spacing 3-4 m. An underlying swale is indicated by the red arrow. The HCS unit is underlain by a thin pebbly, normally graded sandstone of turbidite character (at the level of the hammer. Mid-Jurassic Bowser Basin, northern British Columbia.

This is the third of three posts on tempestites:

  1. Storms and storm surges: Forces at play
  2. Storm surges and tempestites

The recognition of hummocky crossbeds by Harms et al., (1975) was an important moment on the time-line of stratigraphic discovery – it conferred empirical status to storm deposits in the rock record. No doubt there had been multiple observations of this bedform by many investigators prior to this publication, loosely described as “wavy lamination”, or “wavy, low-angle truncated laminae”, or “laminae conforming to truncated ripples”, but the significance of its relationship with “strong wave surges” or storm waves required Harms et al., astute theorizing. Decades later, hummocky cross-stratification (HCS) and subsequently swaley cross-stratification (SWS) have become the go-to sedimentary structures for recognition of major storm events in ancient shelf and delta successions.

Most of our knowledge of HCS as a lithofacies is derived from ancient examples, and a few flume experiments (e.g., Dumas and Arnott, 2006). We now know that there is significant variation in the internal stratification and external bedform of HCS. We also know that HCS-SWS are part of a suite of tempestite lithofacies and sedimentary structures that provide evidence for high energy, relatively short-lived events (tropical cyclones, typhoons, hurricanes):

  • Scour surfaces, lag deposits
  • Sole structures, including gutter casts.
  • Density current, turbidite-like deposits.
  • Other combined-flow bedforms such as modified climbing ripples.
  • Surfaces that abruptly terminate bioturbation.

Much of our attention on tempestites has concentrated on continental shelves, particularly on the shoreface above storm wave-base. However, storms also influence the depositional and erosional record across environments like deltas, lagoons and tidal flats. In this case, one might expect to find tempestites associated with indicators of tidal currents and periodic exposure.

Two earlier articles on tempestites dealt with the basic forces that act on coastal water masses during storms (Coriolis forces, Ekman veering, Geostrophic flow), and the processes that act on the sediment-water interface to produce a stratigraphic record of these high-energy events – i.e., tempestites.

This post looks briefly at the lithofacies associated with tempestites, presented as diagrams that represent a kind of tempestite interpretation time-line over the last 5 decades. The time-line illustrates some of the changes in our collective thinking about HCS and tempestites as depositional events. I have taken some liberties with these diagrams, adding or subtracting information from the original published examples.


Tempestite lithofacies diagrams and models
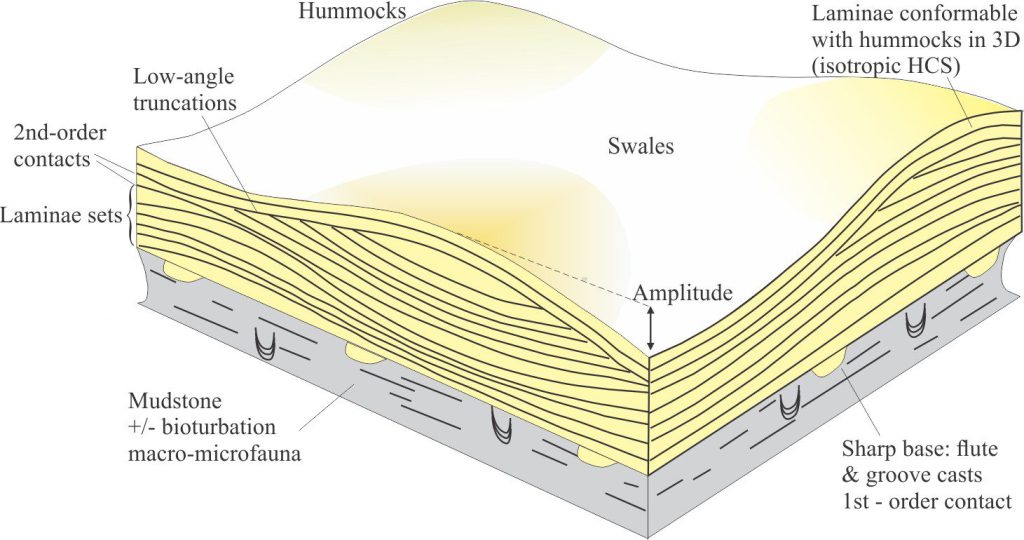
Typical external form and internal stratification of HCS; modified from Harms et al.,1975. The basal 1st-order contact is commonly an abrupt erosional surface. The hierarchy of surfaces is from Dott and Bourgeois’ (1982), where 2nd-order contacts separate hummocky lamina sets.

Harms et al., (1975) original diagram showed the basic 3D geometry of surface hummocks and the conforming laminae in 2D profiles. He noted that the laminae have similar geometries in profiles at any orientation, emphasizing the three-dimensionality of the hummocks and intervening swales, in contrast to angle of repose bedforms like tabular and trough crossbeds; this class of HCS is now referred to as isotropic. The diagram also shows truncation contacts between successive, stacked hummocks.

Dott and Bourgeois’ (1982) idealized column incorporates additional lithofacies and sedimentary structures that help a stratigrapher identify tempestites as high energy events:

  • A basal erosion surface, with or without pebble, intraclast, or shell lags, that commonly preserves a variety of sole structures (e.g., flute and groove casts). The surface probably develops during the waxing stage of storm encroachment.
  • A hierarchy of depositional and truncation surfaces within the main HCS unit.
  • Angle of repose crossbeds that indicate a return to traction-dominated deposition.
  • The succession may be capped by mudstone that contains varying degrees of bioturbation. Mud deposition and cultivation of the infaunal associations are predominantly post-storm.
  • The abrupt, erosional surface capping the succession signals a new, high-energy event.
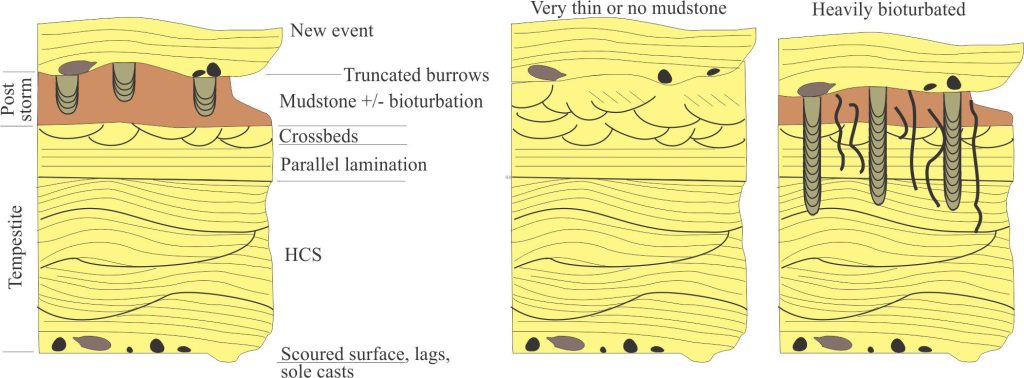
An idealized tempestite-HCS lithofacies assemblage, redrawn from Dott and Bourgeois,1982, Figures 3 and 5. The ideal succession includes a basal erosional surface that probably forms during the waxing stage of storm encroachment. The transition from HCS to crossbedded lithofacies that include trough, tabular, and ripple bedforms, indicates waning conditions presaging a return to fairweather, traction-dominated currents. The mudstone likely contains sediment placed in suspension during the storm but deposited long after the storm abates – it may also contain background hemipelagic sediment. Two of the more common variations on the theme identified by Dott and Bourgeois are shown on the right – one where the mudstone is missing (either not deposited or eroded); and an intensely bioturbated section.

The debate over offshore-directed currents versus geostrophic currents received a boost with the paper by D. Leckie and L. Krystinik (1989). They collated paleocurrent data of tempestite-associated facies from several previously published examples, focusing on structures such as sole marks (flute, groove, and gutter casts), parting lineations, oriented wood, combined-flow ripples, and other indicators of slope orientation from HCS and turbidite-like lithofacies. The vector means for each data group were compared with shoreline orientations inferred from lithofacies (e.g., fairweather wave ripples) and paleogeography reconstruction. The data indicates a preponderance of shore-normal, offshore sediment transport, primarily via combined turbidity currents and storm wave oscillatory currents. Notwithstanding later discussions and critiques (e.g., Snedden and Swift, 1990), the Leckie and Krystinik paper continues to serve as a useful tempestite deposition model.
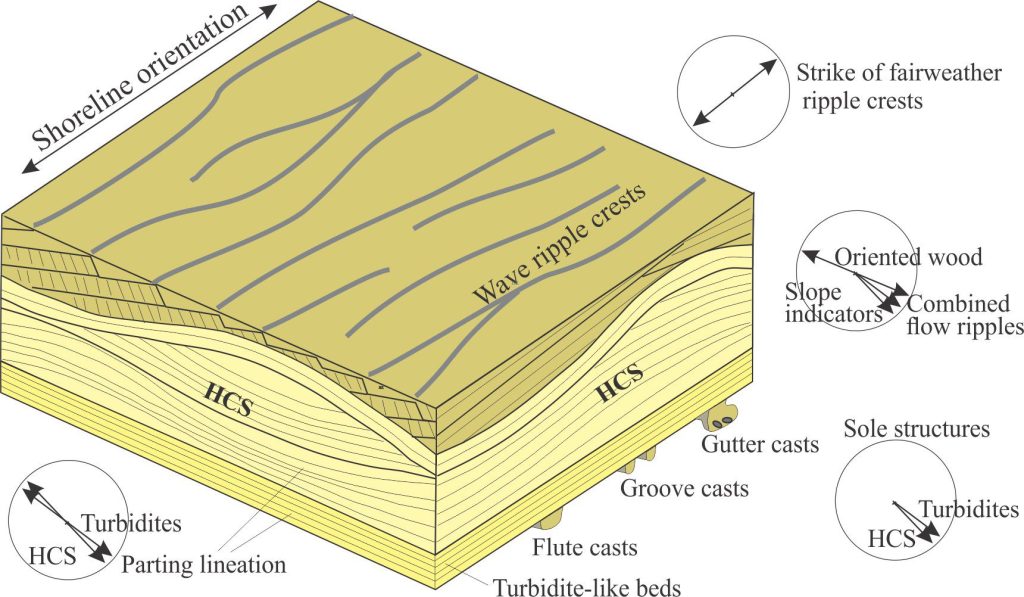
With this diagram I have taken the liberty of extracting a segment of Figure 4 from Leckie and Krystinik (1989) and adding summaries of their paleocurrent data from their Figure 3. The paleocurrent direction for each set of sedimentary structures is presented as the vector mean (arrows), oriented relative to a hypothetical shoreline that was determined from the orientations of fairweather wave-ripple crests. Flute casts and combined-flow ripples allow for reasonably unambiguous paleocurrent determination; groove and gutter casts, parting lineation, and wood orientation are ambiguous indicators of paleocurrents (i.e., their indicated flow directions are 180o apart).
With this diagram I have taken the liberty of extracting a segment of Figure 4 from Leckie and Krystinik (1989), adding summaries of their paleocurrent data from their Figure 3. The paleocurrent direction for each set of sedimentary structures is presented as the vector mean (arrows), oriented relative to a hypothetical shoreline that was determined from the orientations of fairweather wave-ripple crests. Flute casts and combined-flow ripples allow for reasonably unambiguous paleocurrent determination; groove and gutter casts, parting lineation, and wood orientation are ambiguous indicators of paleocurrents (i.e., their indicated flow directions are 180 degrees apart).

Duke et al., (1991) envisage coastal setup driven by refracted, shore-parallel storm waves that increase in power and period as the storm waxes. Return flow generates geostrophic currents that are oblique to the shoreline, currents that interact and combine with oscillatory flow moving sand in suspension and as bedload, depositing flat laminated sand beds (upper flow regime) and HCS. In this model, the strong shore-normal oscillatory flow combines with relatively weak shore-parallel to oblique geostrophic flow.  Geostrophic flow extends over most of the shoreface which means that tempestite sand beds are widely distributed across the shelf. Oblique flow is documented by measuring sole structure and sand grain alignment azimuths. Duke et al., maintain that this combination of flow mechanisms is a better explanation for the shelf-wide distribution of tempestite deposits than shore-normal turbidity currents that have more localised distribution.
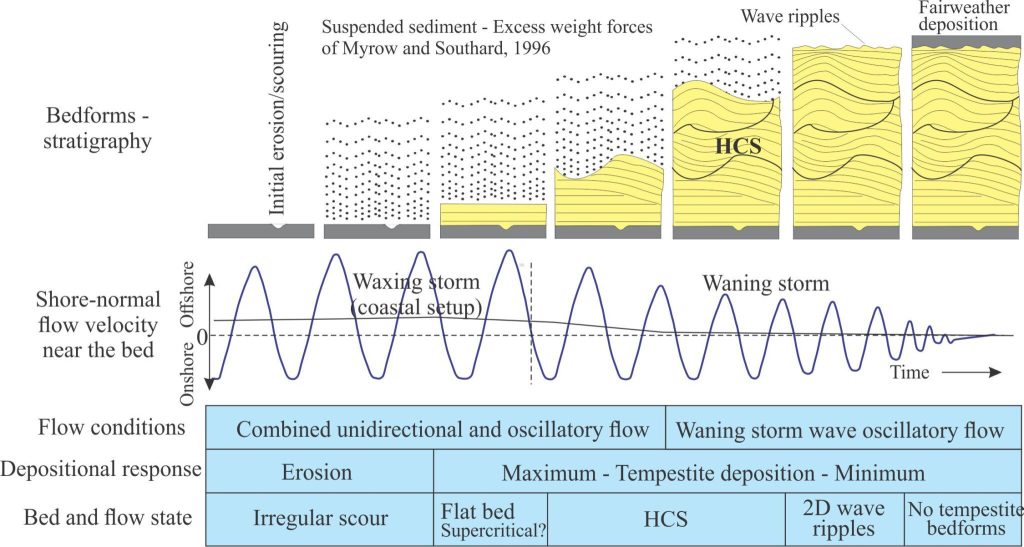
This diagram has been reproduced almost as is from Duke et al., 1991, Figure 5, except for a few extra labels. The sequence of events over a single storm cycle is represented by:- Top panel: Lithofacies succession as the storm waxes and wanes. Flat, or plane-bed sand represents maximum shear stress across the sediment bed at the height of the storm, followed by deposition of HCS during combined geostrophic-wave oscillation flow. At a certain point during the waning stage, wave-orbital induced shear stress is not high enough to form combined flow hummocks – at this stage traction current wave bedforms are more likely to form. - Center panel: The flow velocity profile at the sediment-water interface. - Lower panel: Flow and bed conditions during the period of the storm.
This diagram has been reproduced almost as is from Duke et al., 1991, Figure 5, except for a few extra labels. The sequence of events over a single storm cycle is represented by:
Top panel: Lithofacies succession as the storm waxes and wanes. Flat, or plane-bed sand represents maximum shear stress across the sediment bed at the height of the storm, followed by deposition of HCS during combined geostrophic-wave oscillation flow. At a certain point during the waning stage, wave-orbital induced shear stress is not high enough to form combined flow hummocks – at this stage traction current wave bedforms are more likely to form.
Center panel: The flow velocity profile at the sediment-water interface.
Lower panel: Flow and bed conditions during the period of the storm.

The Myrow and Southard (1996) paper is still one of the best summaries of storm behaviour, flow conditions in the water column, sediment dispersal, and depositional products across continental shelves, acknowledging shore-parallel, shore-normal, and shore-oblique processes. They also introduce the concept of excess weight force, derived from sediment in suspension, as an important driver of sediment distribution across a shelf during storms (it is a function of density). They stress the importance of sole structures for determining the kinds of paleocurrents that can help distinguish between these three paleoflow directions. Their model diagram introduces a triangular plot that incorporates the most likely combinations of flow types at the sediment-water interface, emphasizing the broad range of sedimentary structures – bedforms, sole structures, and stratigraphic succession during a storm cycle.
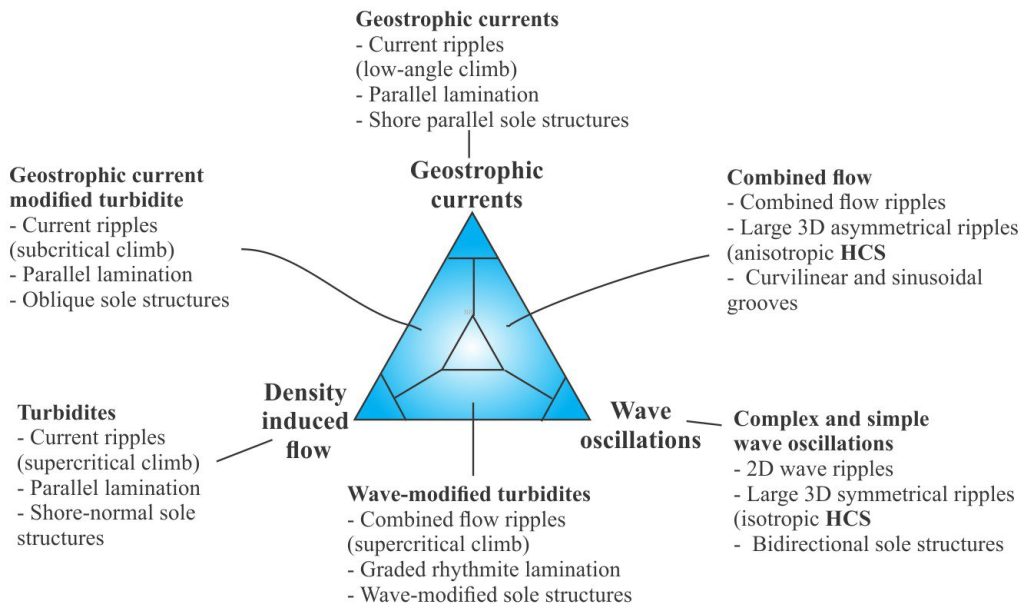
Myrow and Southard's model introduces a tripartite classification of flow types at the sediment-water interface. The triangle apices represent the three fundamental flow types with possible combinations at all other points. It also allows for mapping of pathways as flow mechanisms change during progression of a storm. The diagram is modified from their Figure 7.
Myrow and Southard’s model introduces a tripartite classification of flow types at the sediment-water interface. The triangle apices represent the three fundamental flow types with possible combinations at all other points. It also allows for mapping of pathways as flow mechanisms change during progression of a storm. The diagram is modified from their Figure 7.

Myrow et al., (2002) revamp the ideal tempestite stratigraphic model to include wave modified turbidites, based on Lower Paleozoic shelf deposits exposed in the Antarctic Transantarctic Mountains. Theoretically the model can be applied to geostrophic or shore-normal turbidity currents.  The combined flow components include HCS, upper plane bed parallel laminated, and climbing ripple lithofacies. Myrow et al., distinguish these wave-modified climbing ripples from current ripples by their sigmoidal, convex-up foresets – thus they are less likely to have formed by foreset grain avalanching.

A central part of their paper demonstrates the kind of lithofacies variability in offshore to nearshore environments influenced by storms (i.e., event beds), as well as the variability attendant on changing flow conditions during the progress of a storm. Some of these variations are shown below.

Paleocurrent data for the turbidite components includes ripples, parting lineations, and sole structures; the paleoslope was determined from slump fold vergence azimuths. In this model, the turbidity currents moved downslope, driven, at least partly, by excess weight forces generated by resuspension of shallow shoreface sediment by storm-waves and contributions from hyperpycnal flows.
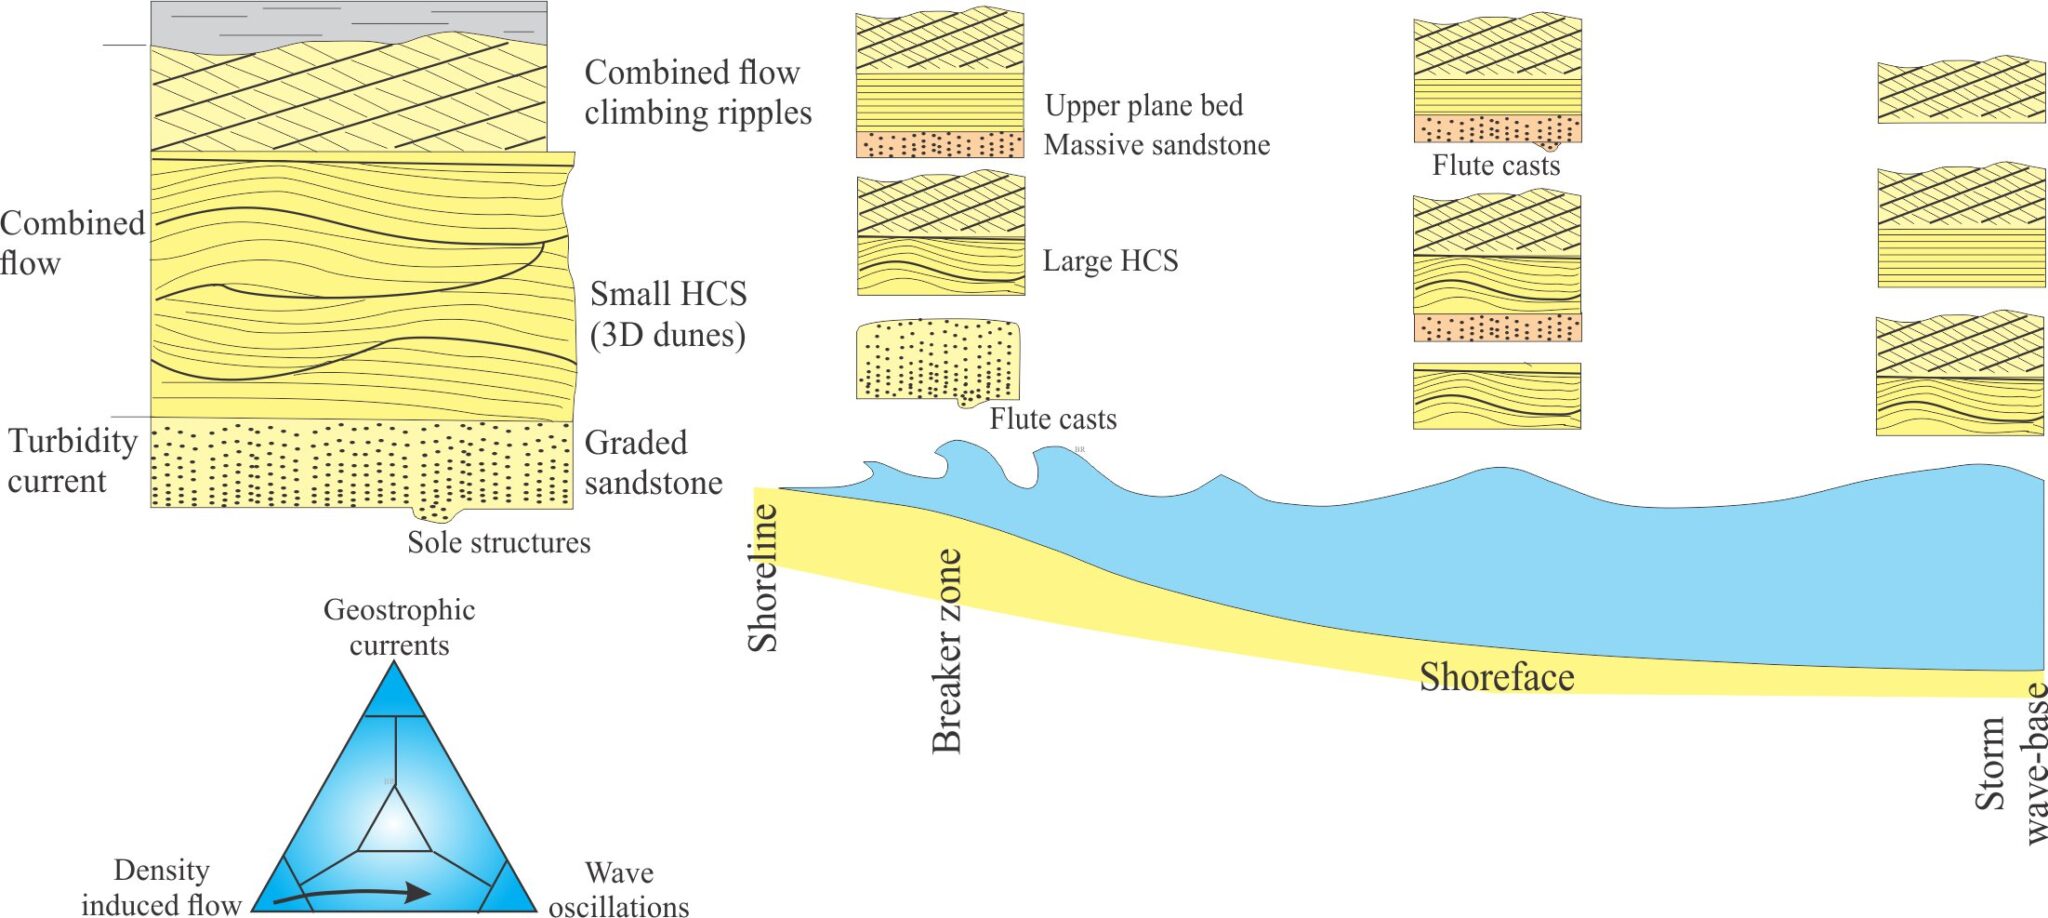
Myrow et al., (2002) idealized tempestite model emphasizes combined flow modification of turbidity currents – i.e., wave-orbital modification (from their Figure 14). The triangular plot (from Myrow and Southard, 1996) maps the transition through the event bed stratigraphy, from purely density current flow to flow combined with oscillatory currents. Myrow et al., also identified several variations on this stratigraphic theme, variations associated with position on the Lower Paleozoic shelf between the paleoshoreline and inferred wave-base (modified from their Figure 7). The main differences in event bed lithofacies are the presence (or absence) of graded or non-graded (massive) sandstones, HCS, upper plane-bed laminated sandstone, and combined-flow climbing ripples, and structures like flute casts and convoluted bedding.

The Dumas and Arnott (2006) model is based on flume experiment observations of the sand-bed response to unidirectional and combined flow. This is an important contribution because it provides sorely needed empirical justification:

  • The relative contributions of purely oscillatory flow versus combined unidirectional and oscillatory flows during the formation of HCS. They demonstrated that isotropic HCS could form under long period waves with moderate oscillatory flow velocities (0.5 to 0.9 m/s) and weak to no unidirectional flow.
  • the relative positions of isotropic and anisotropic HCS and swaley bedding (SWS) across the shoreface – the optimal location is between fairweather and storm wave-base where unidirectional currents will be low enough to produce low-angle hummocky laminae.
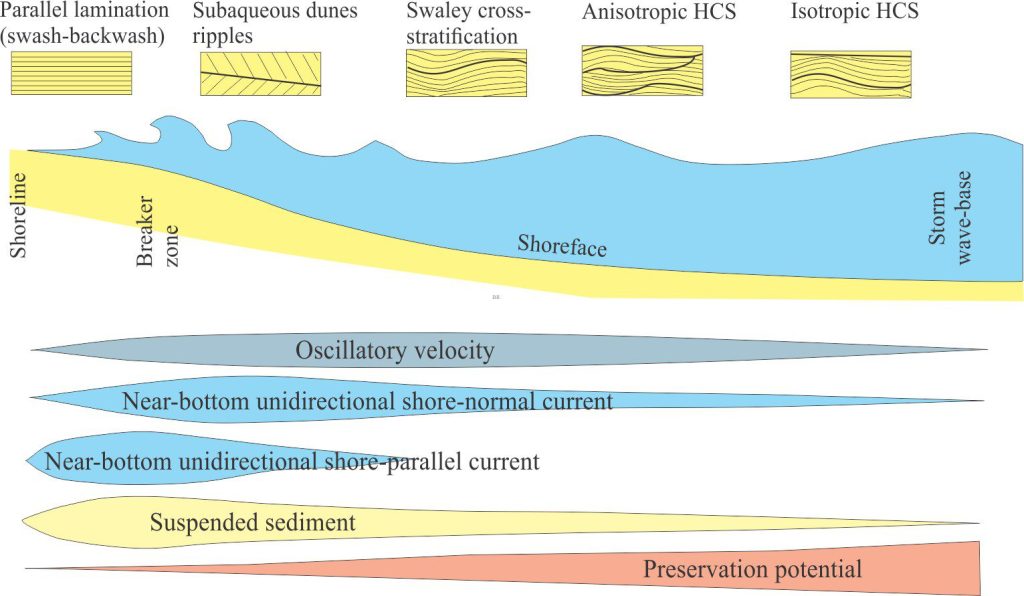
The experiment-based model presented by Dumas and Arnott (2006, Figure 4B) depicts the relative position of important tempestite bedforms and lithofacies across a shelf, from beach to storm wave-base. The preservation potential of HCS related lithofacies increases beyond the nearshore breaker zone; the potential for HCS preservation in the nearshore is dampened by continual reworking of the sea floor by the turbulence from breaking waves and strong wave-orbital motion.

The tempestite model presented by Jelby et al., (2019) was teased from more than 600 storm event bed in the Lower Cretaceous Rurikfjellet Formation, Spitsbergen. Their model provides a good example of tempestite deposition on a storm-dominated prodelta ramp, where hyperpycnal flows formed offshore-directed, bottom-hugging density currents. An important part of the model also recognises the role of both steady and unsteady wave-generated oscillatory flows, summarized in a 3D triangular plot (a modified version of Myrow and Southard, 1996). They identify 6 basic lithofacies combinations that reflect the relative contributions of the different flow mechanisms – two of the more common lithofacies associations are shown below.

Steady versus unsteady oscillatory flow refers to the degree of continuity of wave periodicity and orbital velocity during the deposition of an event bed. Complex HCS is characterized by abrupt variations in laminae set contacts and thickness, that Jelby et al., interpret as the product of highly variable wave orbitals – perhaps reflecting rapid changes in wind direction, or interfering wave sets.

The lithofacies in this model include most of the bedforms and bioturbation observed in other models: isotropic and anisotropic HCS, combined flow climbing ripples, current and wave ripples, plane bed lamination, scour surfaces, sole structures, graded beds, and various kinds of soft-sediment deformation.
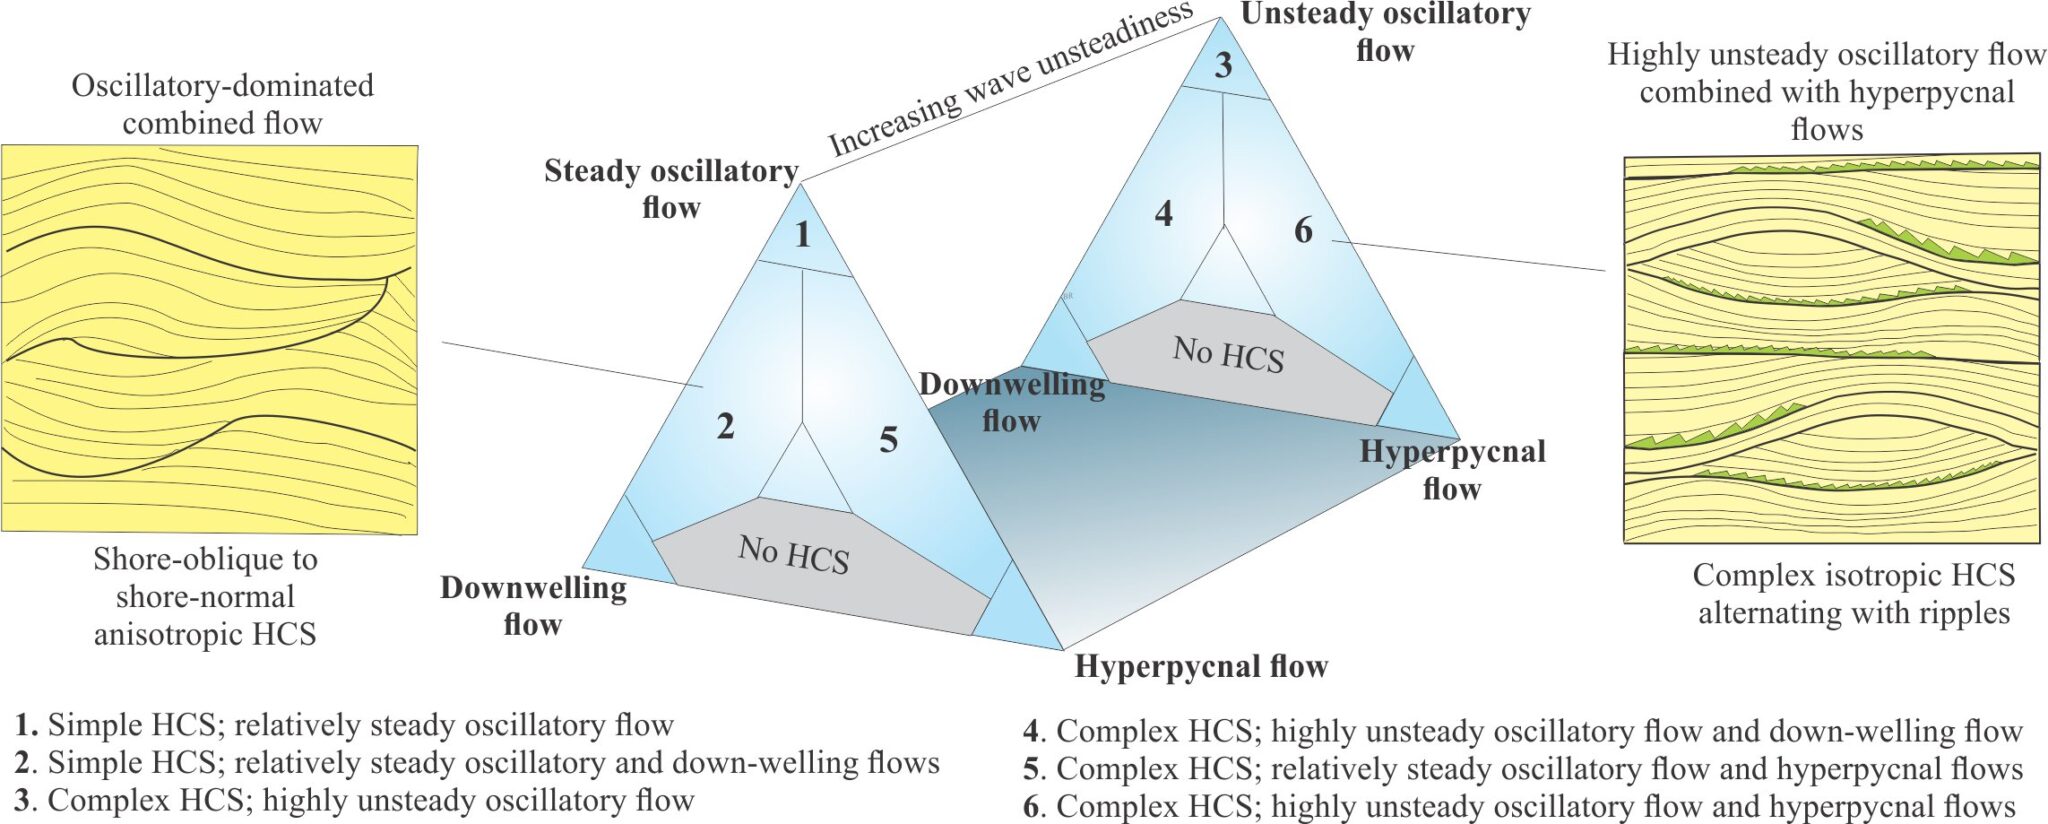
A reorganization of Jelby et al., (2019) Figure 18 showing their modified triangular plot that includes the role of wave oscillation unsteadiness. Two of the more common tempestite lithofacies sections are shown, representing end-member flow conditions (their original figure presents 6 sections, one for each of the main flow domains).

Rationalization of tempestite formation and stratigraphy over the last few decades has concentrated on modern and ancient shelf settings. However, there is increasing recognition that storms also play an important role in the shaping of deltas. The examples presented by Jelby et al., (2019, op cit.) and Vaucher et al., (2023, PDF available)   are good illustrations of this role. Lin and Bhattacharya (2021, PDF available) have taken this a step further with their definition of a new class of delta – storm-flood-dominated deltas. Using the Late Cretaceous Gallup Formation as an example, they develop a model delta stratigraphy and diagrammatic reconstruction that incorporates the common tempestite structures, lithofacies, and bioturbation assemblages that are the storm-flood building blocks of delta lobes and prodeltas. The role of hyperpycnal and hypopycnal flows is paramount.

Gutter casts figure prominently in the Lin and Bhattacharya model. Sedimentary gutters are narrow, channel-like, scour-and-fill structures that are common in ancient shoreface and foreshore deposits but have also been reported in deep water successions. The shallow water varieties are commonly associated with storms, but they may also form during fairweather rip-current flow. Gutters can be straight or sinuous in plan-view, with highly variable profile shapes and sizes – widths from centimetres to metres. They are usually oriented normal to shorelines. They are important components of the storm-flood-dominated delta model because of their association with strong, focused, bottom-current flows, and their paleocurrent orientations.
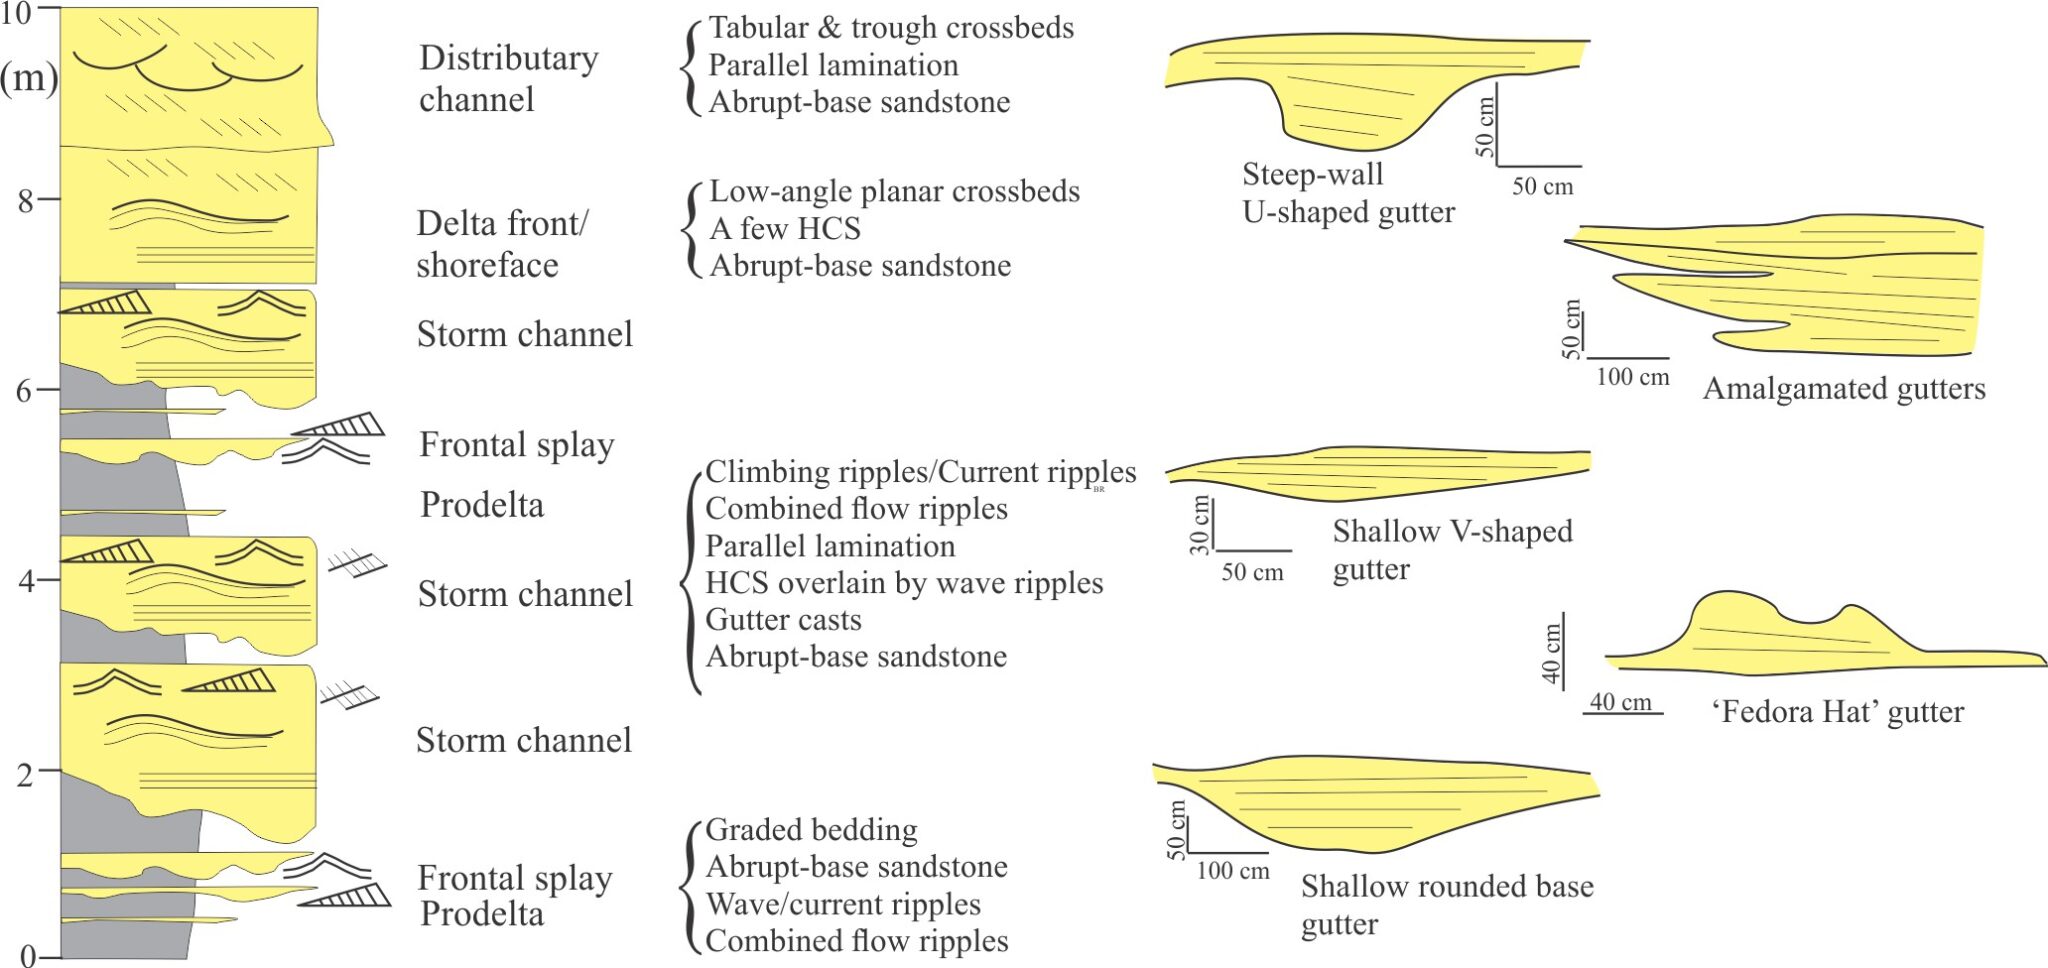
A redrawn (compressed) the storm-flood-dominated delta model presented in Lin and Battacharya (2021) Figure 11 (it's a better fit on screen pages) and included the lithofacies/sedimentary structures listed in Table 1 for each facies assemblage. The upper part of the coarsening-upward succession (delta front, distributary channel) contains mostly traction-dominated bedforms; the lower part (prodelta, storm channel) contains mostly storm-dominated bedforms and stratigraphic surfaces. The model incorporates structures that indicate abrupt, high-energy shifts in depositional style (e.g., abrupt-based sandstone beds that contain gutter casts), and other indicators of storm-influenced deposition – HCS, combined flow bedforms like climbing ripples, and graded beds (particularly in the prodelta sections). The graded beds, common in the prodelta sections, are interpreted as unidirectional hyperpycnal generated flows. Gutter casts figure prominently - five of the more common types of are from their Figure 10.
A redrawn (compressed) the storm-flood-dominated delta model presented in Lin and Bhattacharya (2021) Figure 11 (it’s a better fit on screen pages) and included the lithofacies/sedimentary structures listed in Table 1 for each facies assemblage. The upper part of the coarsening-upward succession (delta front, distributary channel) contains mostly traction-dominated bedforms; the lower part (prodelta, storm channel) contains mostly storm-dominated bedforms and stratigraphic surfaces. The model incorporates structures that indicate abrupt, high-energy shifts in depositional style (e.g., abrupt-based sandstone beds that contain gutter casts), and other indicators of storm-influenced deposition – HCS, combined flow bedforms like climbing ripples, and graded beds (particularly in the prodelta sections). The graded beds, common in the prodelta sections, are interpreted as unidirectional hyperpycnal generated flows. Gutter casts figure prominently – five of the more common types of are from their Figure 10.


Leave a Comment

Your email address will not be published. Required fields are marked *

Archives
Categories
dip and strike compass
Measuring dip and strike
sandstone classification header
Classification of sandstones
Calcite cemented subarkose, Proterozoic Altyn Fm. southern Alberta
Sandstones in thin section
poles to bedding great circles
Stereographic projection – poles to planes
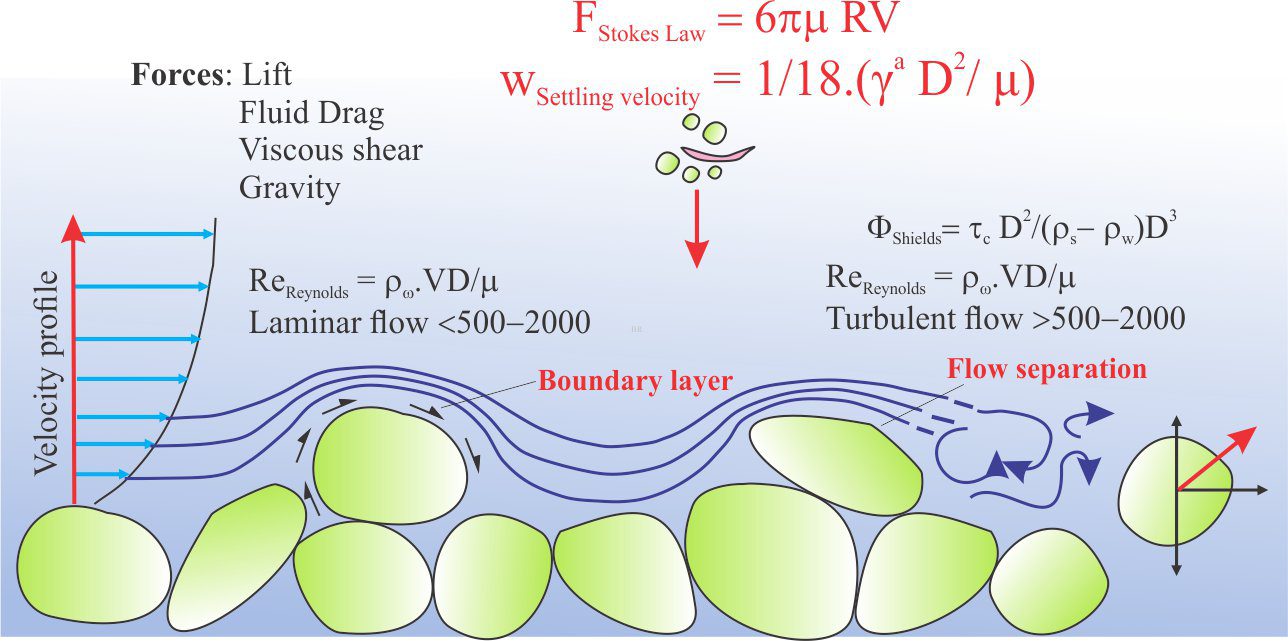
froude-reynolds-antidunes-header-768x439-1
Fluid flow: Froude and Reynolds numbers
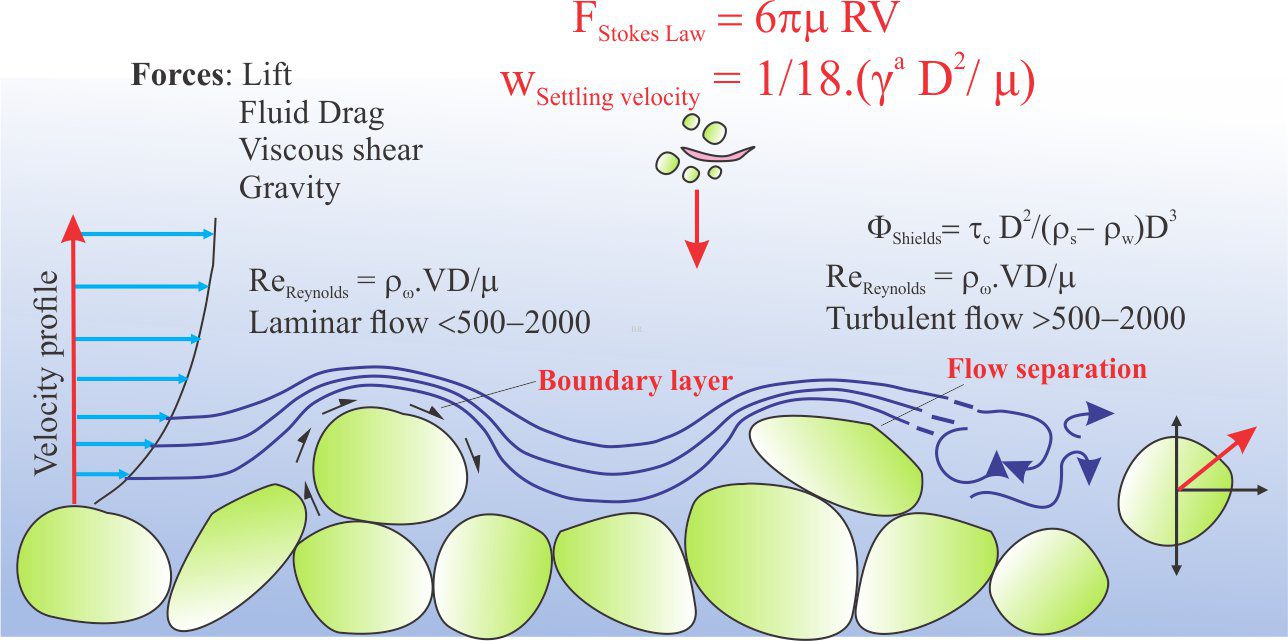
Stokes Law for particle settling in a schematic context of other fluid flow functions
Fluid flow: Stokes Law and particle settling
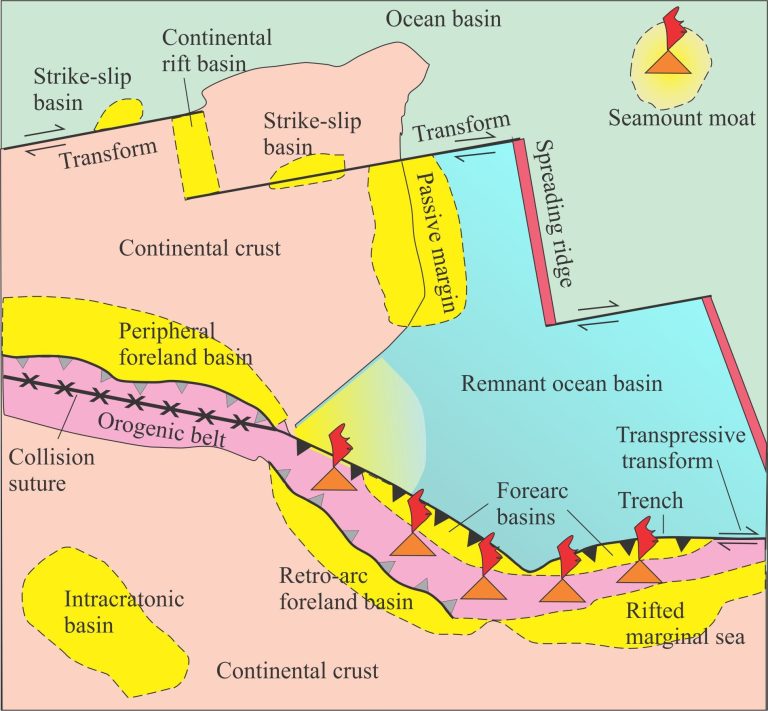
sedimentary-basins-distribution-1-768x711
Classification of sedimentary basins
Model are representational descriptions are written in different languages - diagrammatic, descriptive, mathematical, and conceptual. They commonly contain variables and dimensionless quantities that permit quantitative analysis of the physical systems the models represent.
Geological models
Recent Posts
alice wilson with hammer
Alice Wilson (1881-1964)
Madeleine Fritz in the field
Madeleine Fritz (1896 -1990)
Eunice-Foote-paper-title-1024x404
Eunice Foote (1819–1888)
Regina Fleszarowa
Regina Fleszarowa (1888-1969)
gertrude elles at the outcrop
Gertrude Lilian Elles (1872-1960)
Scroll to Top