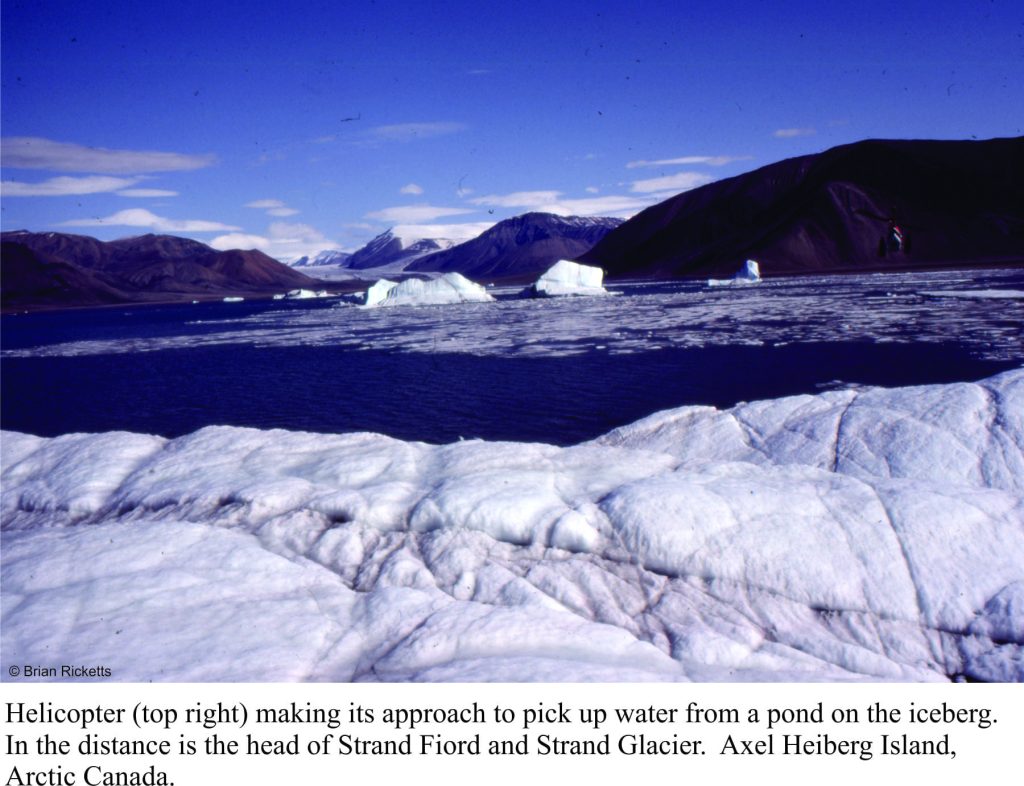
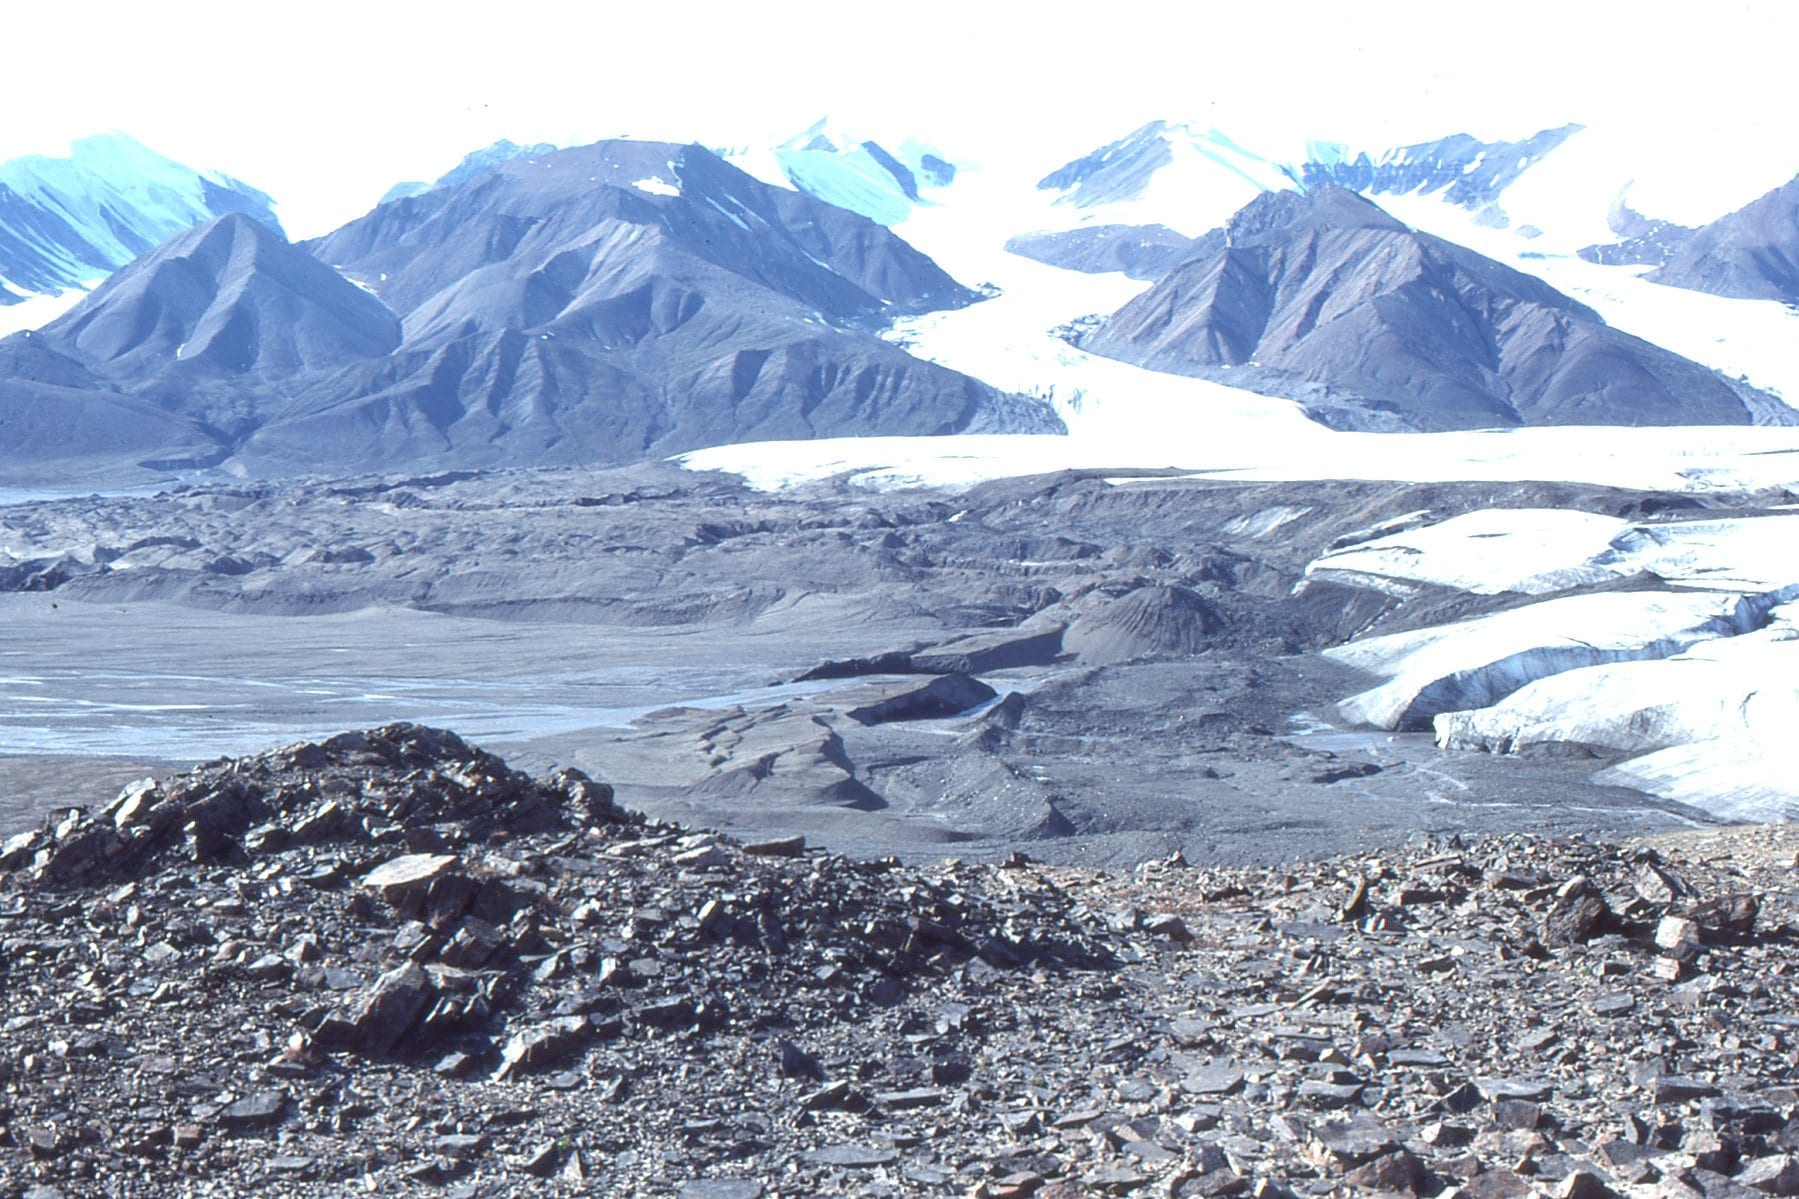
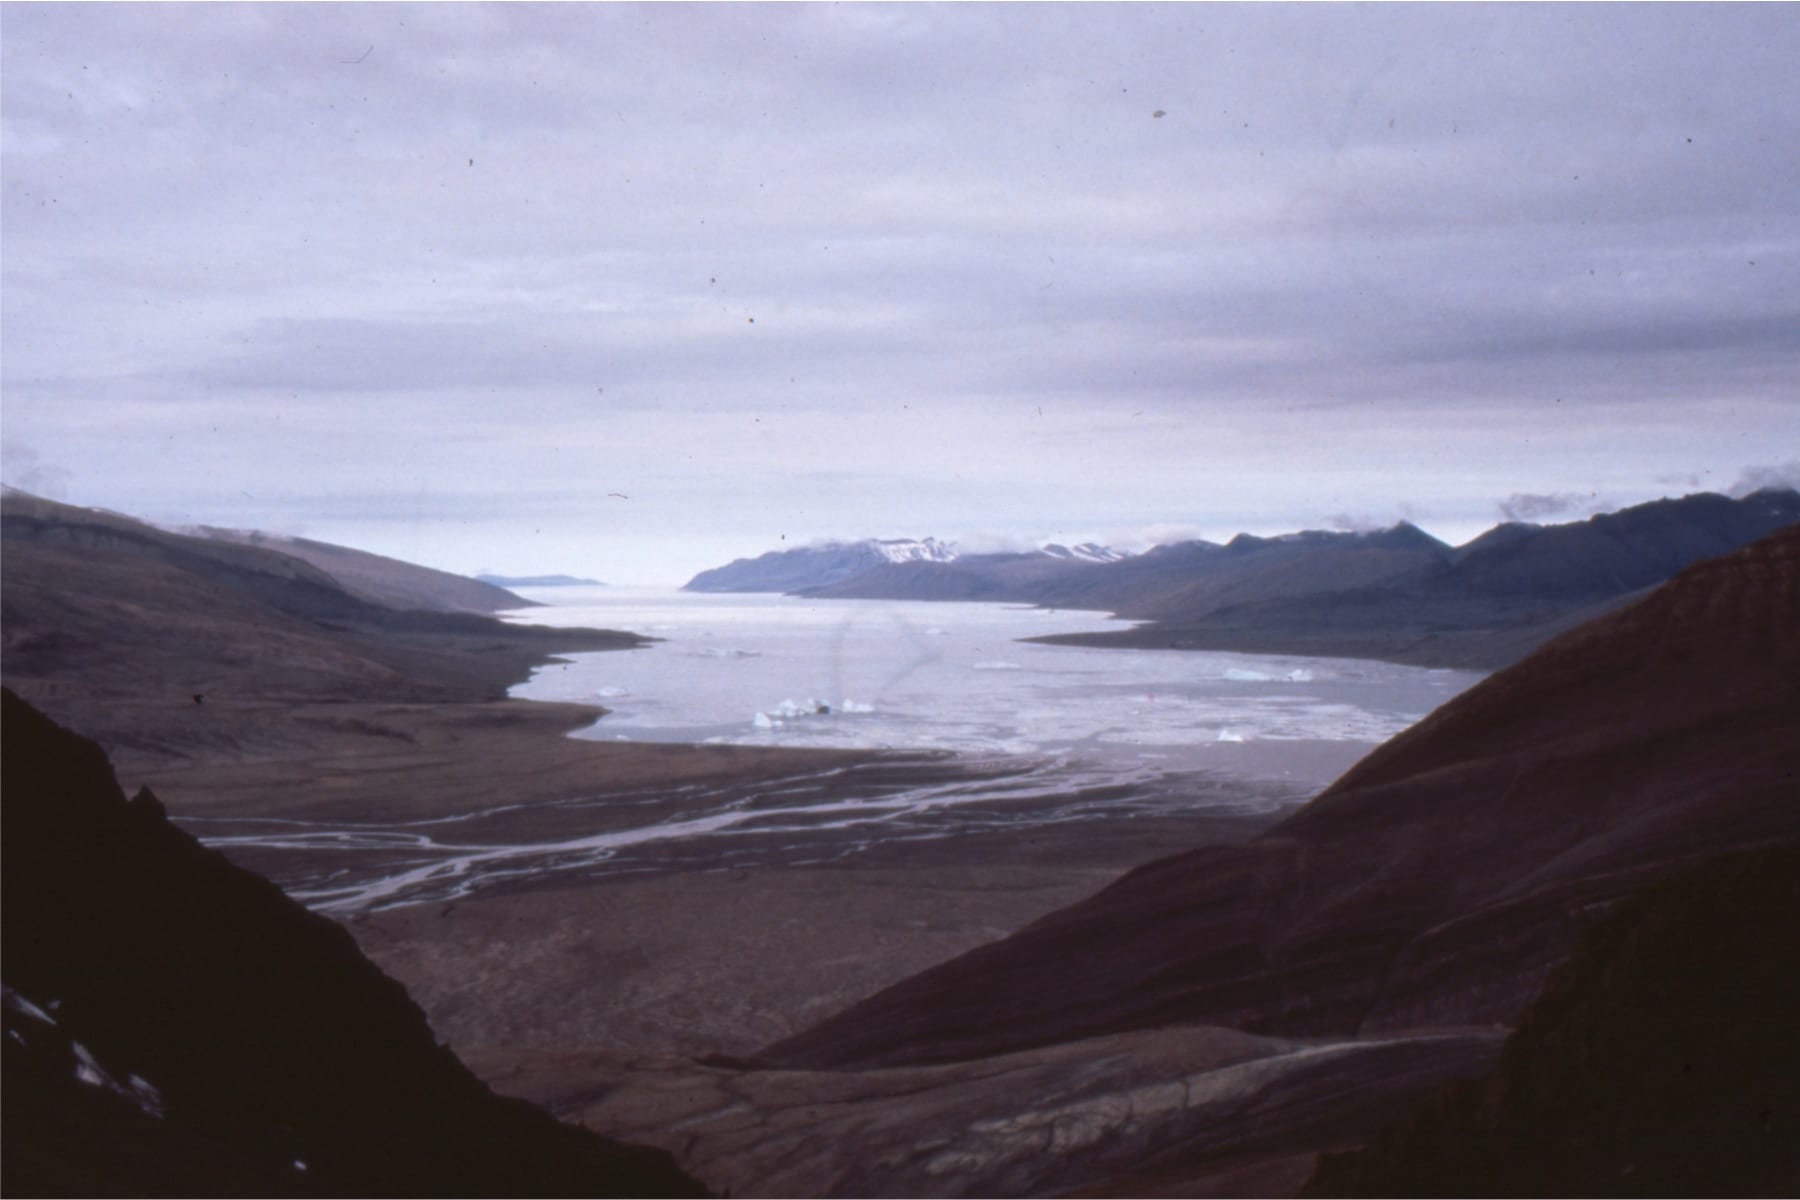
One of my geology field seasons in the Canadian Arctic worked out of a base-camp on Axel Heiberg Island (west of and snuggled against Ellesmere Island). It was the spring thaw and all rivers and streams were muddy. Our only source of clean water turned out to be a small melt-water pond atop an iceberg in Strand Fiord, a few hundred metres offshore. The helicopter would make daily trips with a 45-gallon drum to collect the water. The ice and its water were crystal clear and probably a few thousand years old. It was a treat. Perhaps the only thing missing was the occasional Scotch or G&T.
Carbon dioxide concentrations in the atmosphere have been measured directly for only a few decades. Yet we are confronted with graphs that show CO2 levels and temperatures dating back several 100,000 years; these graphs are central to climate change discussions and debates. Where does the data come from that provides scientists with the justification to not only present these graphs, but to formulate ideas about our changing climate? Part of the answer lies in ‘old ice’.
Geologists have been interested in ancient climates ever since people began to look at rocks and wonder how they formed. Common tools of the trade include the rocks and minerals themselves, their fossil content, their chemistry and their isotopic composition. Ice also contains records of ancient climates. Locked within the ice are dust, aerosols, volcanic ash, and significantly air – air that is as old as the ice itself. This ‘old’ air records concentrations of important gases like carbon dioxide and methane that are central to both the science and debates on our modern changing climate.
Snow, Firn and Ice
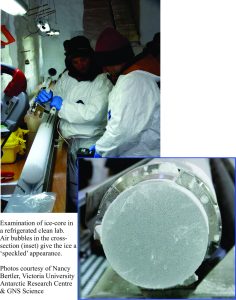 Take a cube of ice from the freezer; you’ll notice it has air in it. Natural ice also contains air that has been locked in during the transformation from snow to ice. Snow, buried year on year by new snow, gradually compacts. As it does so the ice crystals reform and coalesce; this stage is known as Firn, a stage where the density of firn ice is greater than that of snow but less than solid glacier ice. Once firn changes to ice the air is locked in. Formation of firn can take as little as 1-2 years in relatively warm, wet glaciers, to more than 50 years in colder regions like Antarctica and Greenland. The air bubbles contain valuable information on ancient atmosphere chemistry and temperature, but we also need to know how old the ice is.
How old is it?
The composition of glacial ice changes with the seasons. A good analogue for this process is where seasonal changes in tree growth are recorded as annual rings. Likewise, annual layers of ice result from seasonal variations in temperature (that effects the size of ice crystals), dust from forest fires, volcanic eruptions and desert storms, and aerosols like nitric acid and other contaminants. Ice layers have been counted as far back in time as 160,000 years. However, compaction in old ice tends to obscure the deeper layers making them difficult to count. Ice layer counts have been calibrated against independently measured radiometric dates from volcanic ash, and dates obtained from the isotopes Beryllium-10 and Chlorine-36 that form when atmospheric oxygen and argon atoms respectively are bombarded by cosmic rays. In older ice these independent methods assume a greater degree of importance. Using a combination of dating methods the ice record in Antarctica can now be extended as far back as 800,000 years and in Greenland 130,000 years.
Drilling and extracting ice cores can be a tricky undertaking
Short cores a few metres deep can usually be drilled using a hand or mechanical auger. Cores taken from depths or 100-200m require a small drilling rig with a mechanical drive. Two basic types of drill bit are used; bits with hardened steel or carbide teeth that shave the ice, and bits that have heating elements that melt ice around the annulus of the core barrel. One disadvantage of using heated bits is possible heat shock (hot against cold) that may damage or introduce unwanted air and melt water into the cored ice.
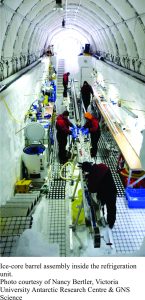 Deep drilling (100s to 1000s of metres), particularly in cold ice, has the added problem of maintaining borehole integrity, especially after the core barrel is retrieved. Drilling fluids used in these projects serve to:
- Lubricate the drill bit,
- Circulate drill cuttings (fragments of ice that break off during drilling) to the surface, where they can be removed from the drill fluid,
- Prevent the hole from freezing each time the core barrel is brought to the surface to retrieve the ice core.
Projects that drill 3-4km can take several years. Core barrels commonly are 3-4m long, so that the entire drill cable and core barrel must be retrieved for every 3-4m of ice drilled. Each time the core barrel is retrieved, the ice core is taken out, sealed and stored in a very large refrigerator at about -35oC. The core barrel is then lowered back in the hole to drill the next section of ice. As an example of this necessarily tedious process, the West Antarctic Ice Sheet Divide Project, which drilled continuous core to 3405m, took 6 field seasons to complete.
Having expended time, energy and $ acquiring the core, we now destroy it
The only way (at present) to analyse all the components of the ice is to melt it. Scientists only get one chance at this for each sample so all the analyses are planned ahead of time. Each ice layer is melted separately under controlled conditions so that the air released from the bubbles can be collected. The chemistry of melt water and any dust it contains are also analysed. In the video link here, Nancy Bertler a researcher at GNS Science describes how this is done.
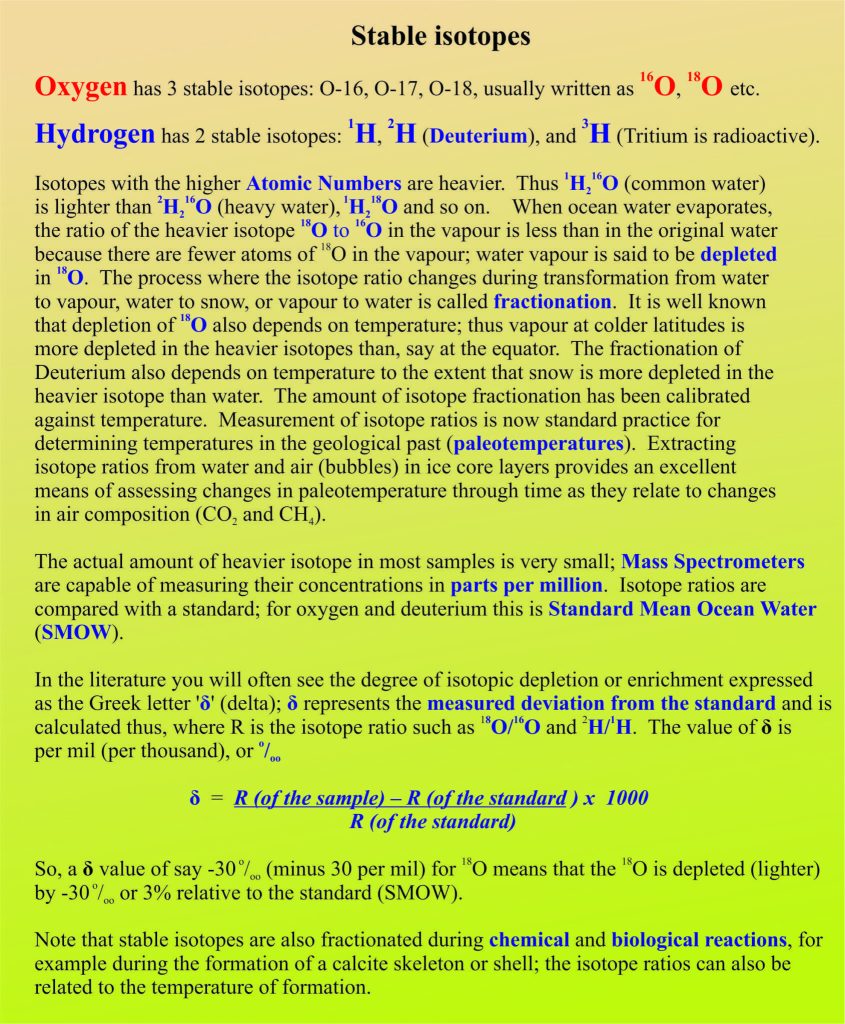
The data allows us to visualize the original composition of the water (snow), air and dust through time. However, one important piece of data is missing; air temperature. Ancient temperatures cannot be measured directly in the ice but excellent proxies for temperature, stable isotopes, can be measured in both the air and water samples. Stable, non-radioactive. isotopes of oxygen and hydrogen are particularly useful because there is a strong temperature-dependence on their presence in compounds like water, carbon dioxide and methane. The text box below explains how stable isotopes give us the temperature data we need.
Some very interesting results
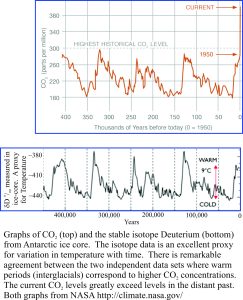
Several organisations now publish graphs and data relating to daily changes in carbon dioxide and methane. Raw data for the last the last few hundred thousand years are also available. Graphical representations of some of this data are shown below. Over time, the concentrations of CO2 in air decrease or increase depending on whether temperatures are rising or falling. Sympathetic trends in deuterium depletion are a good proxy for temperature; cooling and warming trends correspond nicely with the changes in CO2 concentration. Both the isotopic and CO2 data indicate periods of glaciation approximately every 100,000 years over the last half million years or so. This corroborates other geological and astronomical evidence that also indicates fairly regular glacial – interglacial cycles.
The current trends for elevated CO2 and methane began about 18,000-20,000 years ago as global climate and temperature ameliorated following the Last Glacial Maximum. Atmospheric CO2 and methane have now risen to levels not seen in a very long time. Some skeptics still maintain that these greenhouse gas perturbations are part of natural cycles. The other side of the debate presents some pretty compelling evidence that there is a major anthropogenic component to the CO2 increase. Some of this evidence comes from calculations of greenhouse gas budgets (i.e. CO2 and CH4 from different sources) as well as looking at the stable isotope signatures of these gases from different sources. For example the 13C/12C ratios from fossil fuels, deforestation-burning, and other atmospheric sources all show measurable differences that correlate with changing atmosphere composition. Data from the ice-core studies has played a major part in establishing time-lines for the changes in atmospheric greenhouse gases.


2 thoughts on “The Bubbles That Changed our Perspective on the World’s Climate”
Great article…..right up until you cited data from NASA.
Pingback: click here