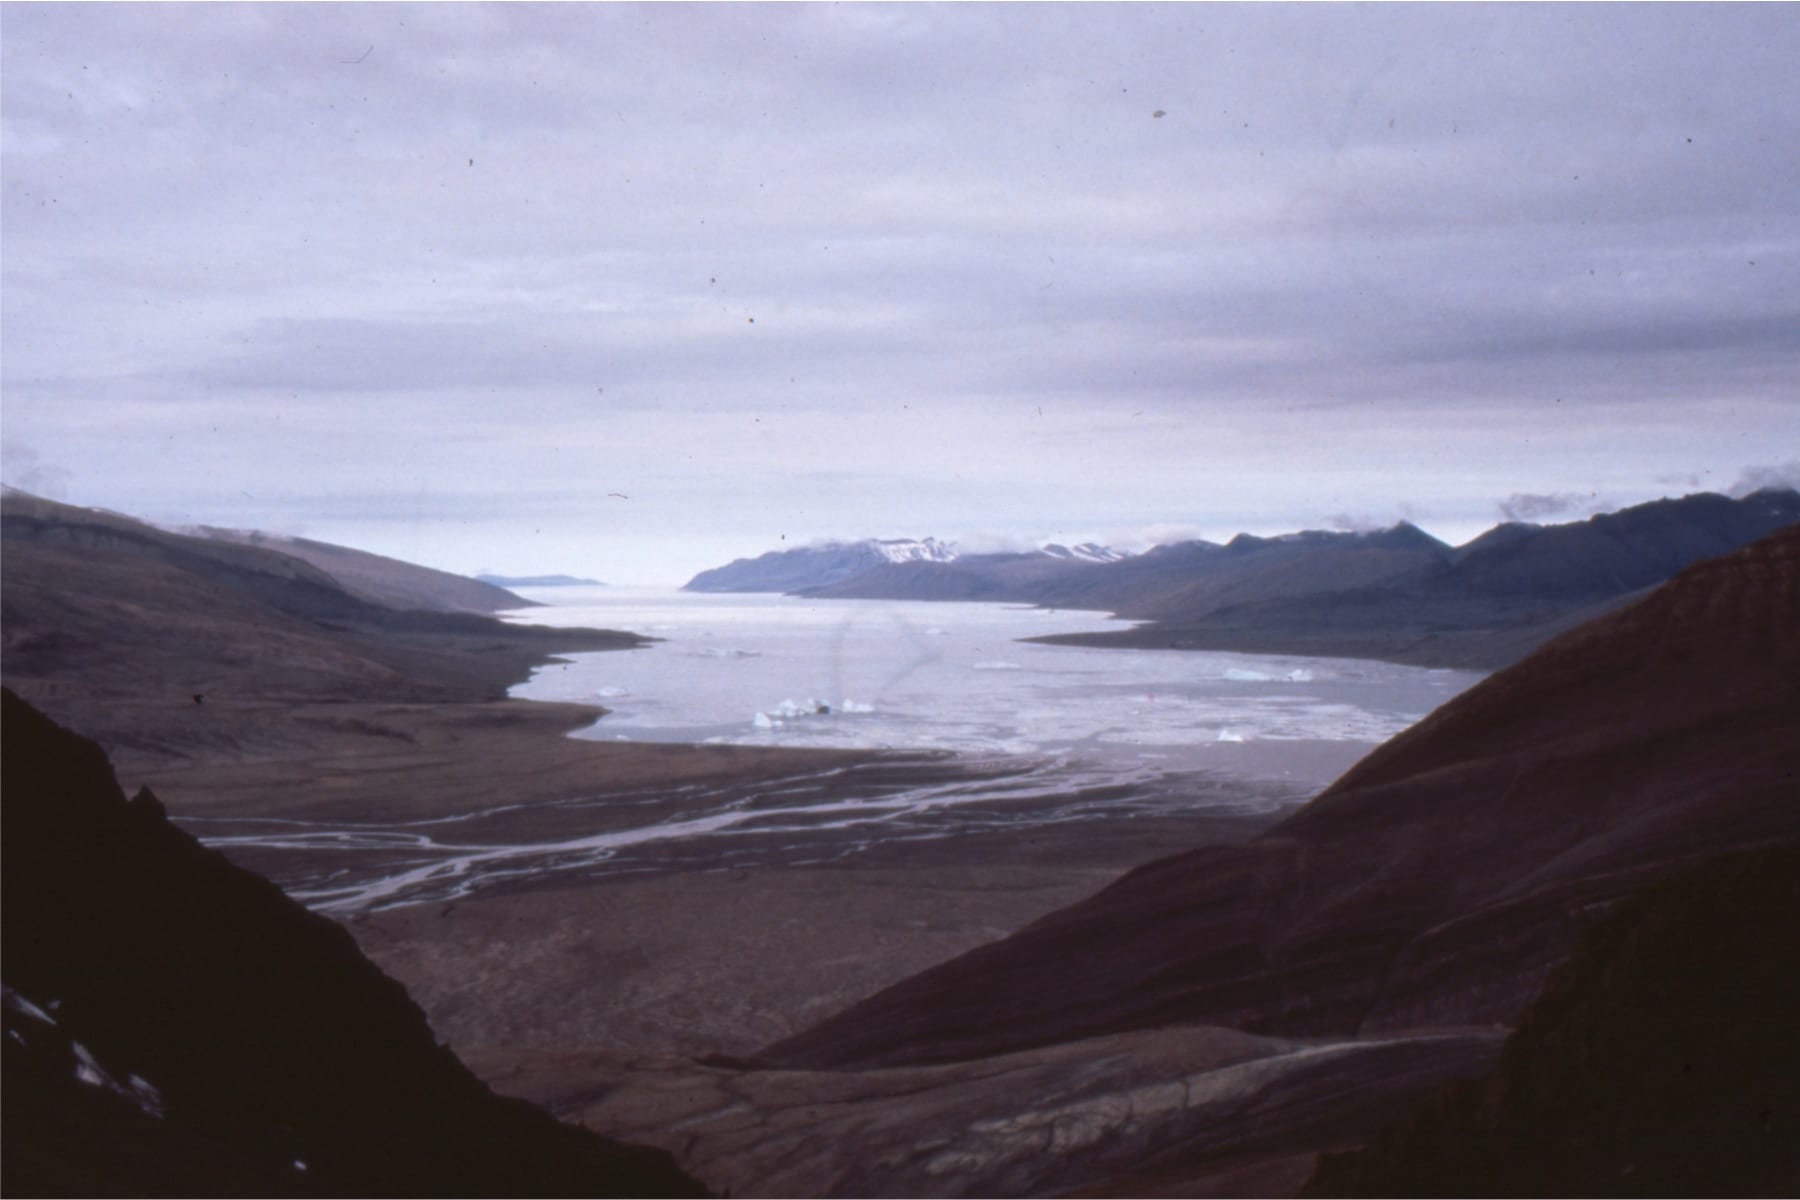
Greenland is giving up its secrets, one at a time
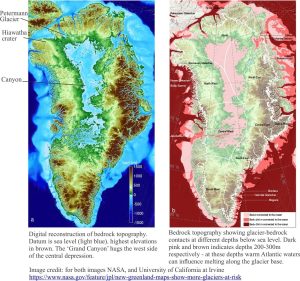
Greenland’s ice-sheet is a significant component of the global ice-ocean volume budget. Ice-sheet waxing and waning has figured prominently in sea level change over the last 3 million years – not quite as long as its Antipodean counterpart. It is front and center of current estimates of sea level change and cold, freshwater through-flow to the North Atlantic Ocean. In focusing on ice budgets and sea level we tend to overlook the fact that the ice-sheet is underlain by bedrock. Melting can take place at the base of an ice-sheet as well as the top. Ingress of warmer seawater at the base of an ice-sheet (where it meets the coast) exacerbates melting. Coastal ice acts as a kind of buttress to the interior regions of ice sheets, which means that changes in melting and calving at the coast will affect ice-sheet dynamics in the interior. Thus, knowing the depth and topography of the buried bedrock surface will permit more accurate estimates of ice volumes, and the kind of data needed to rank ice-sheet – coast intersections at risk of increased melting and calving.
We catch glimpses of Greenland’s bedrock along its coast. The foundations are metamorphosed Precambrian sedimentary and igneous rocks as old as 3.9 billion years. Zircon crystals in some of the rocks are even older, indicating the presence of solid crust more than 4 billion years ago).
The most widely used measure of ice thickness uses radar signals beamed from planes and satellites. Radar signals travel through the ice until they are reflected from boundaries like the top of the bedrock. Radar signal reflection is based on the different electrical properties of ice and bedrock (the process is analogous to reflection of seismic signals from different rock layers in the earth, but in the case of radar the signals respond to changes in electrical properties rather than changes in density). It’s a bit like lifting a veil; you never know what you might find.
The radar data is collected along intersecting flight paths, presenting a grid that extends over most of Greenland. Several programs have gathered data over large swaths of the island, the most extensive being NASA’s Operation Icebridge which has produced ice thickness measurements over flight paths totaling more than 580,000 km. A comprehensive analysis of all this data (involving an international consortium of 32 institutions) was published in a 2018 issue of Geophysical Research Letters (lead author M. Morlighem).
Ice thickness, and therefore depth to bedrock data is used to refine digital reconstructions of bedrock topography, provide more accurate calculation of ice volumes and, in the event that the ice melts, the potential rise in sea level based on the increase in ocean volume (currently estimated at 7.42m, notwithstanding other effects such as rebound of the landmass and surrounding ocean floor; i.e. isostatic rebound).
New coastal bathymetry data was also used to map the depth below sea level at the point where glaciers enter the sea. These depth measures are important at depths greater than 200-300m because the exposure of ice to warmer ocean waters exacerbates subglacial ice melting, calving, and ice-front retreat at the contact between bedrock and ice. Identifying glaciers that are susceptible to ocean-forced melting is an important part of ice-budget monitoring (see maps at top of page).
The subglacial bedrock topography presented in these maps was reconstructed using present sea level as the datum. The central region (blue colours) is below sea level and corresponds to a region of thick ice. Overall, about 22% of Greenland’s ice is below sea level. Reconstructions like these represent Greenland with all ice instantly removed. This kind of portrayal is useful to see what presently lies beneath the ice, but in reality if substantial melting did occur the landmass and adjacent continental shelf would begin to rise in response to reduced ice loads. Isostatic rebound begins almost immediately and would continue long after the ice has disappeared. The central depression, in large part caused by the present weight of ice, would potentially be as high or at higher elevations than the adjacent margins in the event that it fully rebounded to its position before ice began to accumulate.
A Grand Canyon
The new data has allowed investigators to probe other features of the subglacial topography. Greenland’s own version of a ‘Grand Canyon’ wends in sinuous fashion almost 750km from the central part of the island, north to the fiord into which Petermann Glacier empties; in places it is 800m deep (published in Science, 2013 – unfortunately it is not Open Access).
Have a look at this NASA video.
It lies beneath about 3km of ice; it is also below sea level. For size it rivals Arizona’s Grand Canyon. The irregular outline, depth and general rugged appearance suggests that the channel and its incision into bedrock formed before the ice sheet at least 2-3 million years ago. Subglacial channels can provide drainage for meltwaters at the base of the ice sheet and as such will influence the dynamics of ice flow. This is a massive structure, but how and why it formed and its effect on ice sheet behaviour are still to be guessed at.
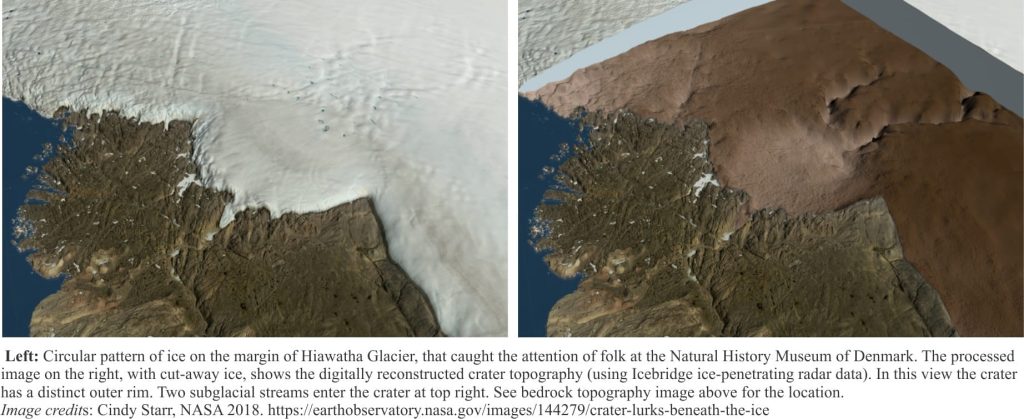
West of the Canyon on the northwest fringe of the ice sheet, an intriguing circular shape in the ice led researchers at the Natural History Museum of Denmark to probe deeper into NASA’s Icebridge data. Initial investigations indicated a sympathetic structure in the underlying bedrock. Additional airborne radar was acquired that subsequently confirmed their suspicions. Buried beneath a kilometre of ice was a crater, 31 km in diameter, about 300m deep, with a raised outer rim and raised center.
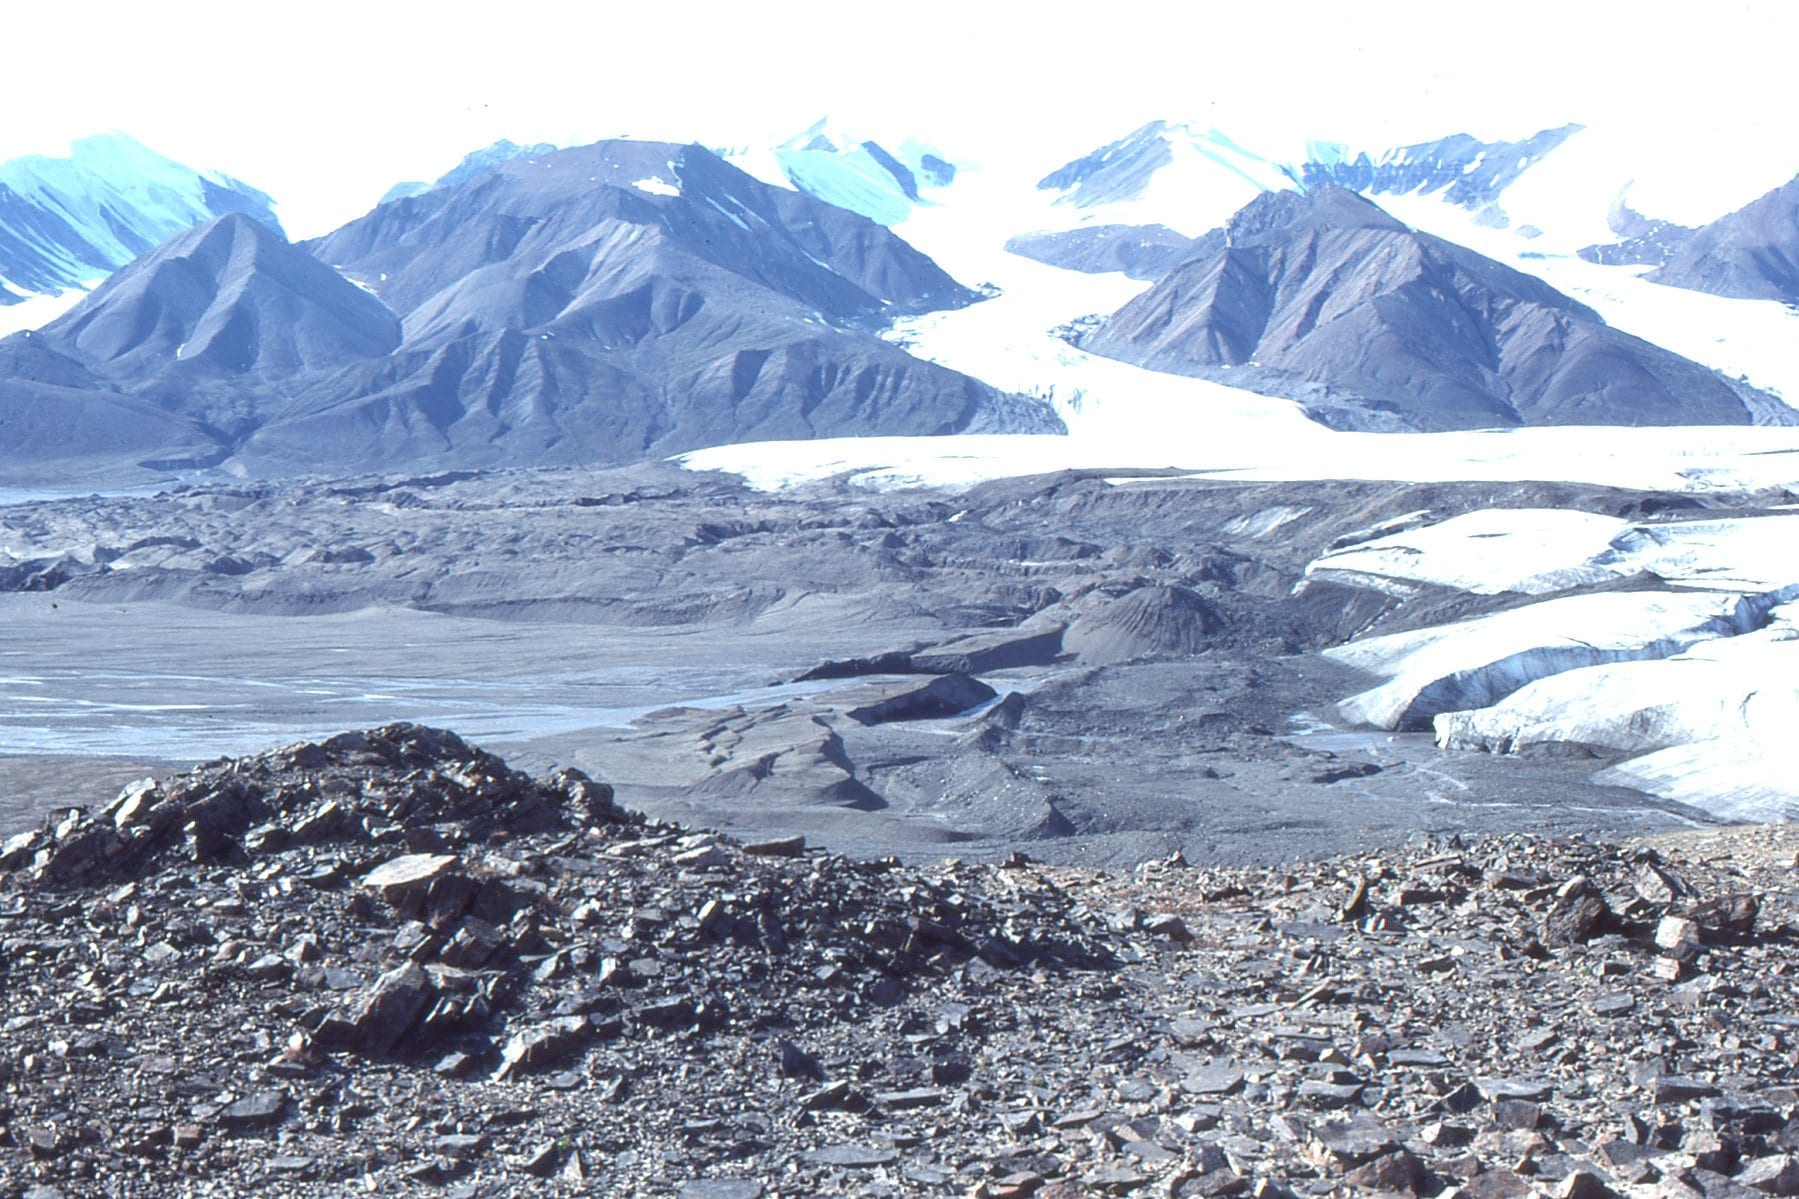
The morphology revealed by the radar data would probably have been enough to convince most people of its extraterrestrial origin. Fortuitously, the ice sheet here is drained by a couple of subglacial streams that appear to pass through the structure. Sediment samples were collected from streams where they emerge from the ice. The discovery of quartz crystals exhibiting evidence of high-pressure shock (shock lamellae visible in microscope views), provided the necessary confirmation. This is indeed a meteorite impact crater, the result of a bolide about a kilometre across; in size it ranks 25th on an Earth scale. The radar data also suggests that fragmented bedrock is incorporated into ice near the base of the ice sheet, in which case the impact was probably quite recent – perhaps no more than two million years ago. This was a sizeable impact and it is intriguing to ponder its effects on the course of Pleistocene evolution and climate. It is the first impact crater to be discovered beneath an ice sheet.
Like the deep oceans, ice sheets contain hidden worlds. Remote sensing, like ice-penetrating radar, allows us to ‘see’ what lies beneath. There seems little doubt that Greenland and Antarctica will reveal more geological treasures.
Addendum
The age of Hiawatha impact crater, and therefore the impact itself, have recently been updated – it appears to be much older than previously determined. A paper by Kenny et al., 2022 (open access) in Science Advances describes 49Ar-39Ar dating of shocked zircons from fragments found in glacial outwash immediately downstream of the crater. The new date is 58 Ma – which is Late Paleocene, and is about 7 million years after the (end Cretaceous) impact that finished off the dinosaurs (among other organisms).
