Of the two certainties in life, volcanoes offer the most excitement (death and taxes are basically the same thing). They are magnificent while asleep; a primeval ruggedness that stirs the imagination. We paint them, we eulogise them. And when they awaken, we run for cover. Whether in a state of dormancy or high agitation, they leave an impression on our inner and outer landscapes.
All active volcanoes emit gas; pre-, during and post-eruption. On average, 96% of volcanic gases are water vapour, the remaining components being CO2, SO2 (most common), plus a little helium, nitrogen, carbon monoxide, hydrogen sulphide, and a few halides. Volcano-derived carbon dioxide is frequently cited as a culprit for increasing atmospheric CO2 concentrations in climate change debates. However, it is sulphur dioxide, not carbon dioxide that does most of the short-term damage to climate.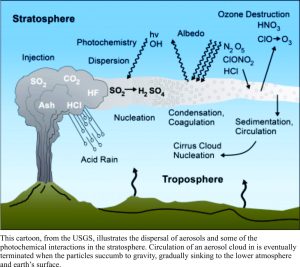
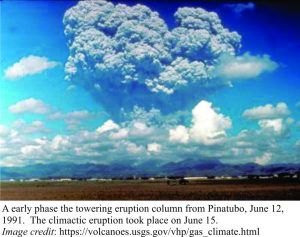
Aerosols reflect solar heat energy back into space, thus altering the radiation (heat) balance in the lower atmosphere. Major eruptions in the 18thC and 19th C are known to have drastically lowered surface temperatures by 1-2oC. Total emissions during Iceland’s 1783-84 Laki fissure eruption is estimated to have released 120 million tonnes of SO2. Tambora (1815) and Krakatoa (1883) both released huge volumes of gas, resulting in lowered surface temperatures and subsequent social disruption in the northern hemisphere. Europe in 1815-16 is often referred to as the Year Without a Summer. On a more creative note, large eruptions also produce some spectacular sunsets, captured equally spectacularly by artists like the English painter William Turner (image above).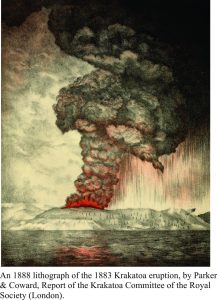 One of the largest eruptions of the 20th C, Pinatubo (1991, Philippines), was responsible for releasing about 17 million (mega) tonnes of SO2 into the stratosphere (the eruption column reached 40 km!). Within a year, the aerosol cloud had extended globally, resulting in an average 0.5 – 0.6oC lowering of surface temperatures that persisted for about 3 years.
The aerosols, in addition to the more obvious climate forcing, also react chemically with ozone, drastically reducing concentrations, particularly in the southern Hemisphere (of concern to me because that’s where I live). Sulphate aerosols in the stratosphere clearly have a major impact on climate forcing; they produce significant, measurable, surface cooling. The average temperature change may not seem particularly acute, until you realize that even with such a small change, the winters can be much more severe and crops can failure. However, most of these cooling events are short-lived, because the eruptions, as violent and cataclysmic as they appear to those on the ground, are also short-lived. Aerosols eventually capitulate to the force of gravity, falling to the lower atmosphere.
Carbon dioxide is also released by volcanic activity. Indeed, in the climate change debate, this source is frequently touted as the primary cause of increasing atmospheric CO2. Most of this CO2 is eventually mixed with the bulk atmosphere. Here are a few numbers to think about. The 1991 eruption of Pinatubo, in addition to the climate altering SO2, released about 42 mega tonnes of CO2. Mount St. Helens, relatively tiny in comparison, gave us about 10 mega tonnes over a 9 hour period. The Eyjafjallajokull eruption (March 20 – May 23, 2010), perhaps better described as a disruption, produced about 150,000 tonnes of CO2 a day, that, assuming continuous release over the 64 days, amounts to 9.6 mega tonnes – much the same as Mount St. Helens. Of course, gas release from this or any vent, does not begin or end with an eruption. Gas is likely being released, albeit at much lower levels, well after an eruption has ended.
Calculations by the USGS of total land-derived and submarine annual volcanic CO2 contributions, puts the number between 200 and almost 500 mega tonnes. Other estimates put the upper limit at about 600 mega tonnes. The numbers here are derived primarily from erupting centres, vents and fissures. But there is also background seepage, not from spectacularly erupting columns, but from diffuse flow of gas through soils, fractures, nooks and crannies in areas surrounding the volcanically active vents. Background diffusion probably occurs over periods of time that are much longer than the obvious eruptive periods. One current estimate suggests that this mechanism adds about 250 mega tonnes of CO2 to the atmosphere. Diffuse CO2 release may be a much longer-term effect than most short-lived volcanic eruptions. This begs the question that, if it is long-term, then perhaps we should also consider it to be a continuous source of CO2, a longer-term component of the carbon cycle, and therefore, not responsible for any temporal change in atmospheric CO2 concentration.
Can we gauge the possible effects of volcanism on the concentration of CO2 in the atmosphere? Current estimates of global CO2 emissions from all anthropogenic sources are 40 Giga (billion) tonnes. Clearly, none of the historical eruptions comes even close to this level of gas release. Current estimates of total volcanic emissions top out at 600 mega tonnes; if we add diffuse CO2 emissions then the figure approaches one Giga tonne (but I’m not convinced that any, or all of the diffuse CO2 should be added), but still falls well short of any significant contribution.
One final comment. The increase in well-mixed, atmospheric CO2 is well established. If the frequency or size of volcanic eruptions has not changed over the last few decades, or indeed centuries, then the overall contribution of CO2 also would not change (notwithstanding major SO2 events that lower surface temperatures). If the main culprit of atmospheric CO2 rise is volcanic emissions, then there would either need to be an increasing level of volcanic activity, or the average size of eruptions should be increasing. I have not found any quantitative data that might allow one to argue this particular case.
Addendum
In a 2018 paper published in Geophysical Research Letters, measurement of CO2 emissions by the (non-erupting) Katla volcano in Iceland, shows amounts of 12,000 – 24,000 kilo tonnes/day CO2 is released – Katla is buried by a glacier and has not erupted for about 100 years. This amounts to almost 4% of annual CO2 contributions by non-erupting volcanoes (this does not include erupting volcanoes). If other non-erupting centres contribute similar volumes of CO2, then the total natural contribution is greater than first thought. However, it needs to be emphasized that such CO2 contributions are relatively continuous, existing long before the addition of excess anthropogenic CO2. In other words, Katla adds to the background levels, rather than an increase in total atmospheric levels.
E. Ilyinskaya and others, 2018, Globally significant CO2 emissions from Katla, a subglacial volcano in Iceland. Geophysical Research Letters, v. 45, Issue 19, Pages 10,332-10,341



10 thoughts on “A burp and a hiccup; the volcanic contribution of carbon dioxide to the atmosphere”
Pingback: employment recruiters
Pingback: educational sites
Pingback: dormant
Pingback: online education degrees
Pingback: finance companies
Pingback: financial planning help
Pingback: business finance
Pingback: health
Pingback: health & wellness articles
Pingback: fifa 18 coins