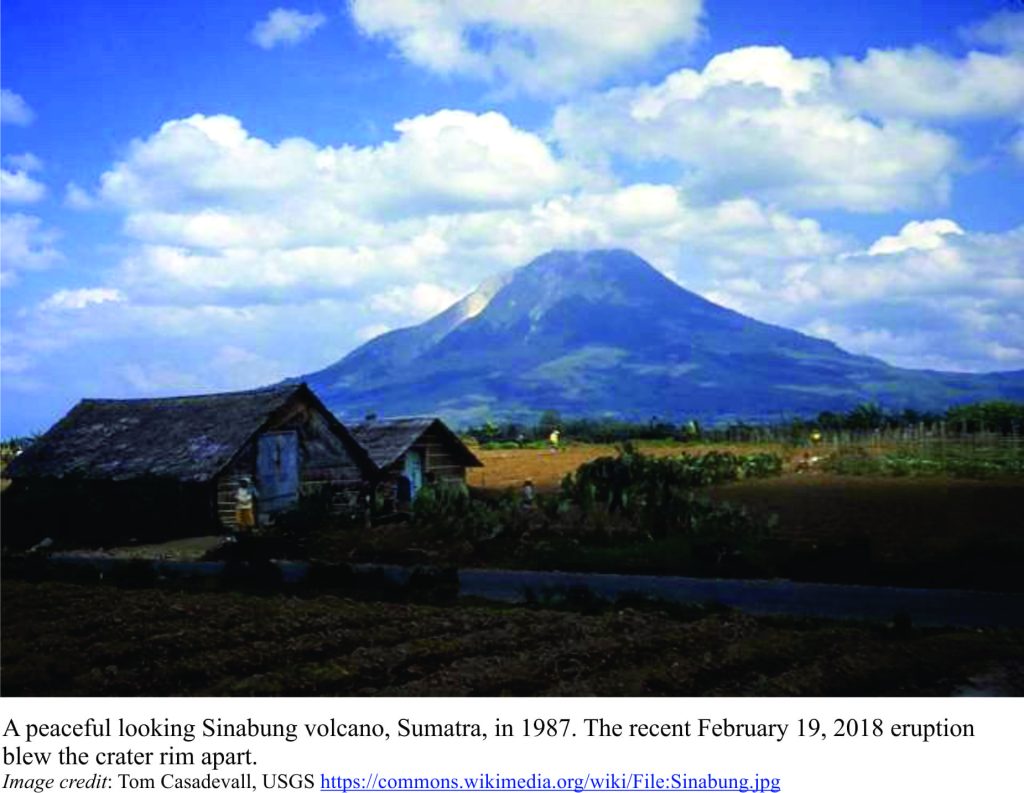
 A peaceful morning, zephyrs, whispy clouds wrapping, scarf-like, the towering edifice that is your town’s backdrop. A sudden roar; the clouds are shredded. The turmoil of a volcano with attitude, a billowing column of ash and rock, tossed effortlessly skyward, reaching heights of 5 to 7 km in a matter of minutes. Not content with this scene, parts of the column collapse into fast-moving, ground-hugging pyroclastic flows that smother and incinerate everything in their path. This was Sinabung a few days ago (February 19, 2018 – the Youtube video is worth watching).
The Indonesian volcano is regarded as active and has been erupting off and on for about 7 years, following a 400-year slumber, although the violence of this event caught many by surprise. Happily, it was short-lived and no lives were lost. But the event does illustrate the fickleness of volcanoes, and like a case of indigestion, a bad-tempered, frequently unpredictable response to rumblings in their internal plumbing. Eruption prediction ideally should provide sufficient warning to all those who live nearby; Sinabung decided otherwise.
Which just goes to show how difficult it is to predict an eruption. It’s one thing to suggest that Sinabung will erupt sometime in the next few months or years, based on its recent history, and quite another to predict it will do so next week. So, what are the predictive tools at a volcanologist’s disposal?
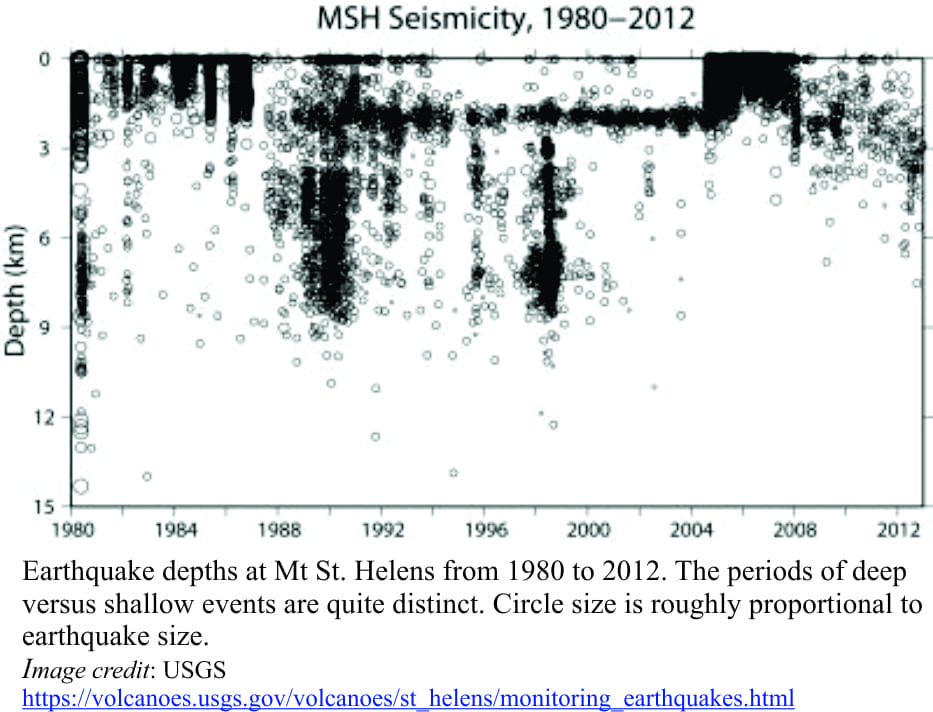
Top of the list, and probably the tool that results in most media misinformation and hype, is seismology – the measuring and analysis of earthquakes. Earthquakes and volcanoes go hand in hand, but not just during the lead up to eruptions. Magma that rises through the earth’s crust creates stress in the surrounding rock, resulting in fracturing and shaking. The frequency of these low magnitude earthquakes commonly increases as the magma pushes close to the surface. Data from several seismographs (the instruments that measure earthquakes) can be used to estimate the earthquake depth; an important piece of information that provides an indication of how far the magma has moved. Earthquakes that become progressively shallower may mean the magma is rising. The plot of Mt St. Helens events shown below nicely illustrates these characteristics. There are very distinct groups of shallow and deep earthquakes, the deeper ones probably recording the stress of deep magma movement, including introduction of new magma, and withdrawal of magma. Shallower quakes represent adjustments to magma cooling, movement of heated groundwater, and stress from the movement of magma at depth.
Volcanic earthquakes can also be generated by processes other than impending eruptions, such as the normal flow of hot groundwater. Seismographs are so sensitive that they will record the thud as chunks of rock fall off a crater rim, cracking ice, helicopters, and even claps of thunder. All this extraneous, background noise needs to be filtered from the actual signals of a volcano adjusting itself.
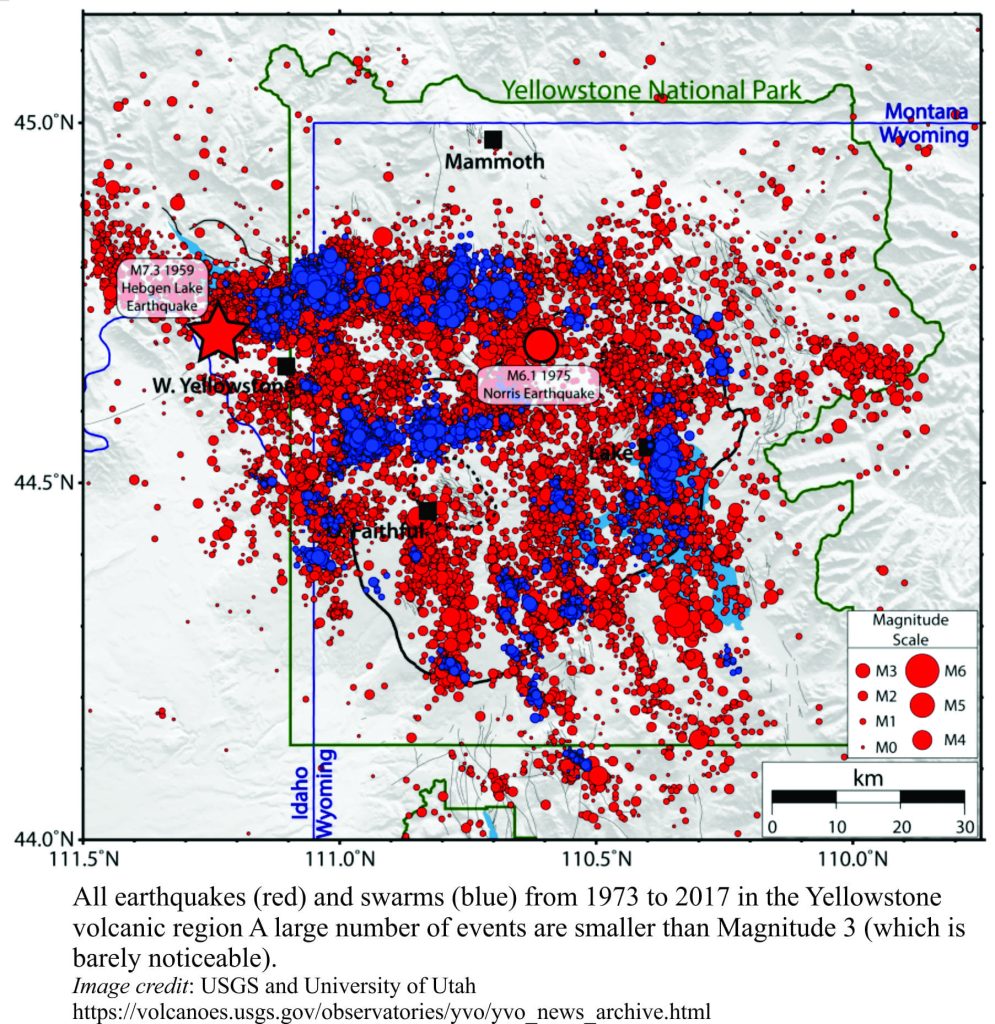
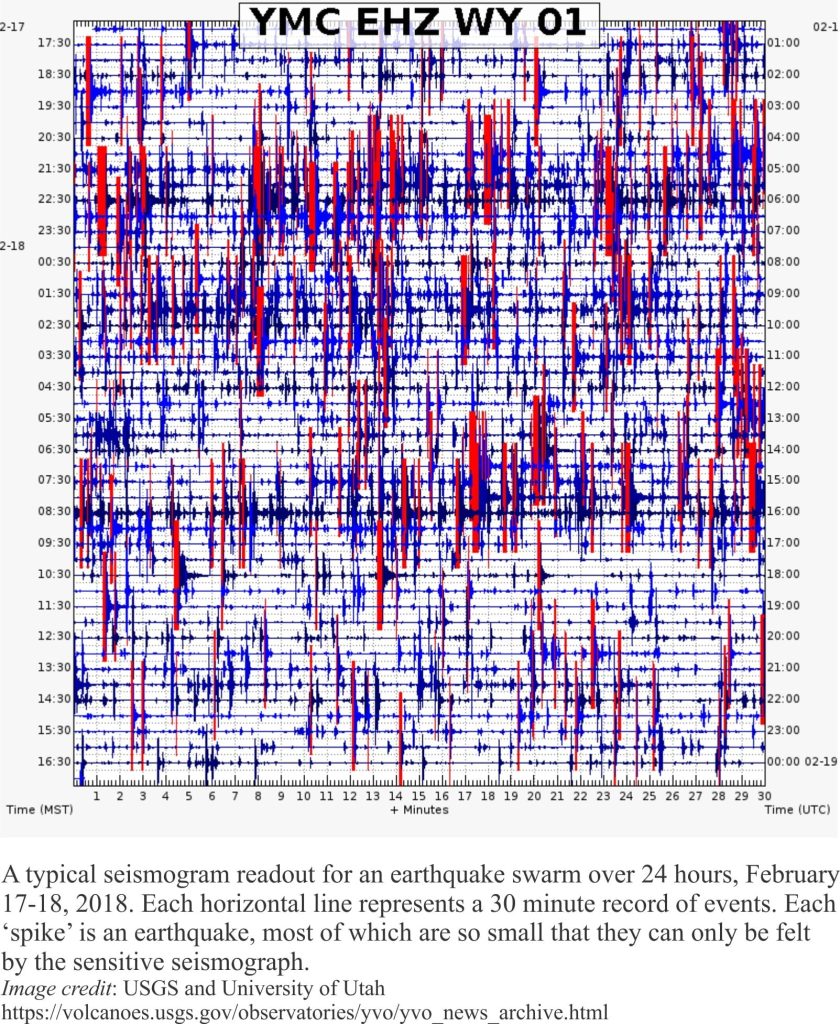
Volcanologists take particular note of earthquakes that occur in swarms, where dozens or 100s of small quakes occur within a brief time period. Earthquake swarms, like any single event, may indicate impending eruption, but they can also result from normal tectonic activity not related to an eruption, or changes in geothermal groundwater flow. The Yellowstone super-volcano is a good example where recent earthquake swarms have sent some media into ‘imminent eruption’ conniption fits. The explanation for these swarms, that Yellowstone is going through minor readjustments to background tectonic stresses (particularly stress generated in the Basin and Range province) and the flow of underground fluids, is a bit more mundane although scientifically important. As the map below indicates, earthquakes and earthquake swarms have been frequent visitors to Yellowstone for the last 45 years, and none of them was associated with an eruption.
Volcanic tremors are a different kind of seismic record that, unlike earthquakes, represent a kind of low frequency rumbling that may continue for several minutes. This kind of shaking is too slight to be felt by anything other than a sensitive seismograph. They generally are associated with the twisting and turning of rising magma, although some may be caused by the turbulence of hot groundwater. Tremor bursts commonly precede an eruption and therefore, are an important component of a volcanologist’s toolkit.
The seismic history of volcanoes is complex, but as a general rule, volcanologists tend to sit up and take notice whenever there is an increase in earthquake activity, especially if the specific events indicate rising magma or increasing gas pressures within a volcano’s plumbing. A volcanologist’s tool kit includes other kinds of measurements that help mitigate any ambiguity in the seismic records. An important and measurable response to rising magma, in addition to fracturing of the surrounding rock, is the deformation of the land surface. Automated GPS can now provide real-time measures of any tilting or bulging in craters or volcano flanks.
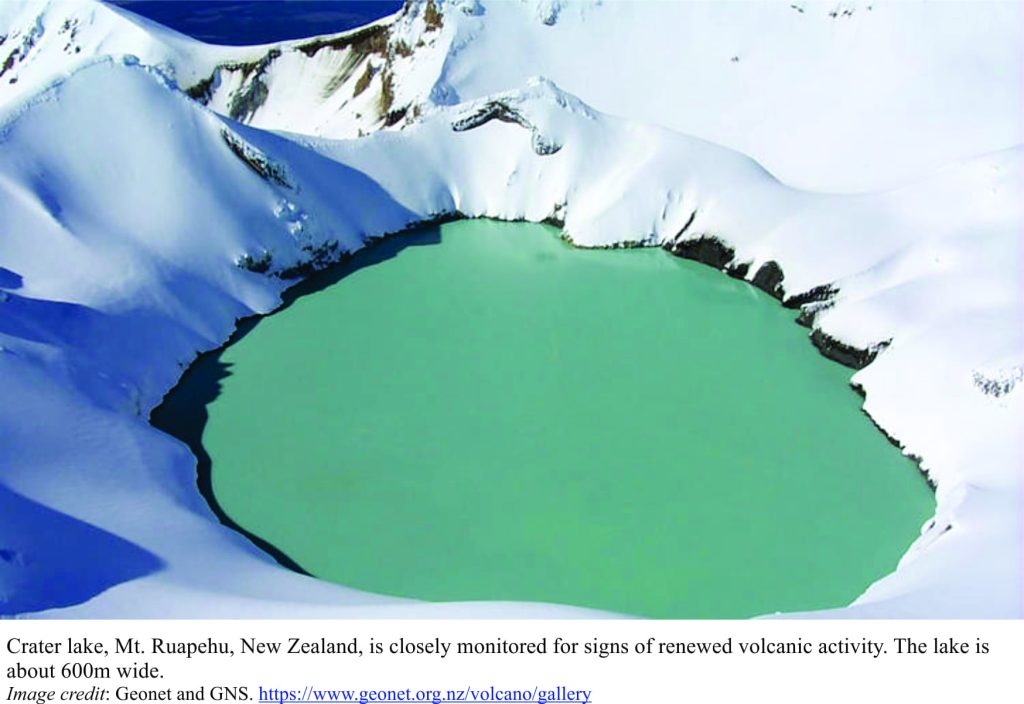
Rising magma will usually cause groundwater temperatures to rise and an increase in fumarole activity (like hot pools and steam eruptions). One of the key indicators on Mt. Ruapehu (New Zealand) is a crater lake, where water depth, temperature and pH (acidity) are constantly monitored; any increase in lake activity that is associated with a change in seismicity, will ring alarm bells (literally) [Ruapehu crater lake has also been responsible for some disastrous lahars].
An increase in the common volcanic gases carbon dioxide (CO2) and sulphur dioxide (SO2), may also point to rising magma. These can be measured on site (with due care and attention), or remotely by some of the more recent satellites (spectroscopic instruments). Thermal images, that are used to map changes in heat patterns, can also be captured by aircraft or satellites.
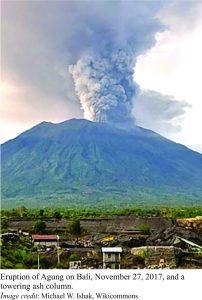
Volcanoes all have different characters; some are effusive (mostly lava flows), while others have anger management problems and become violently explosive. The science of eruption prediction has progressed hugely in the last 30-40 years, with advances in seismic detection and remote (satellite) monitoring. Scientific research is adding more tools to the volcanologist’s kit, and the successful prediction of eruptions is becoming more frequent. Witness the success of monitoring recent events on Mt Agung (Bali, Indonesia), where 80,000 were evacuated from September through November, 2017, prior to significant explosive eruptions, pyroclastic flows and destructive lahars (mud flows) in late November. There was significant disruption to the Bali economy, but few lives were lost, and I guess that really is the bottom line. Volcanoes are intrinsically fascinating; from day one they have played a pivotal role in shaping our earth. But the real benefits to society are counted in the lives saved by a deeper scientific understanding of their moods.
