Seismic metaphors, or seismic as metaphor? Seismic, a word that geologists and geophysicists traditionally thought was reserved for their use, has been purloined by politicians and social scientists to describe momentous shifts in things like public attitudes and voter propensities. Seismic is the anglicized derivative of the Greek verb seien, (shake) and the word seismos (earthquake). Apparently, it first appeared in English language writing about the mid-19th century. Personally, I find it satisfying that the social milieu sees fit to apply the scientific word in such a useful, metaphorical sense.
The word seismic is also a nice descriptor of our restless, physical world, especially the bits we live on. Most of the earth’s crust is under stress, some parts more than others. Most stresses are generated by the movement and jostling of tectonic plates, particularly at boundaries where plates converge, collide, or slide past one another. Different parts of the crust respond to stress by bending; this includes seemingly hard, immovable rock. If the stress is removed then the deformed rocks return to their original states; this is referred to as an elastic response. However, if the earth materials are bent too far or too fast, they will break. An interesting analogue for this process, and a historical one, is the collapse of a Tacoma suspension bridge in 1940.
Here, steel girders and tarmac bent and twisted under stress until the deformation reached a limit (called the elastic limit), at which point the bridge failed. When the earth’s crust fails, the seismic event, or earthquake, can be devastating. Earthquakes are caused by the sudden brittle failure of rock under stress; the failure takes place along a fault, across which land (or sea floor) is moved up, down, or sideways. The rapid displacement of rock masses produces pulses of energy, or seismic waves. It is these waves that do the damage.
There are two main kinds of seismic wave; body waves that propagate through the earth’s interior, and surface waves that move along the earth’s surface. Body waves include a primary, or P-wave, and a secondary or S-wave. P-waves travel fastest; they are also called compressional waves because they tend to push and pull materials as they propagate. Slower S-waves, or shear waves, produce a side-ways motion. Shear waves are not transmitted 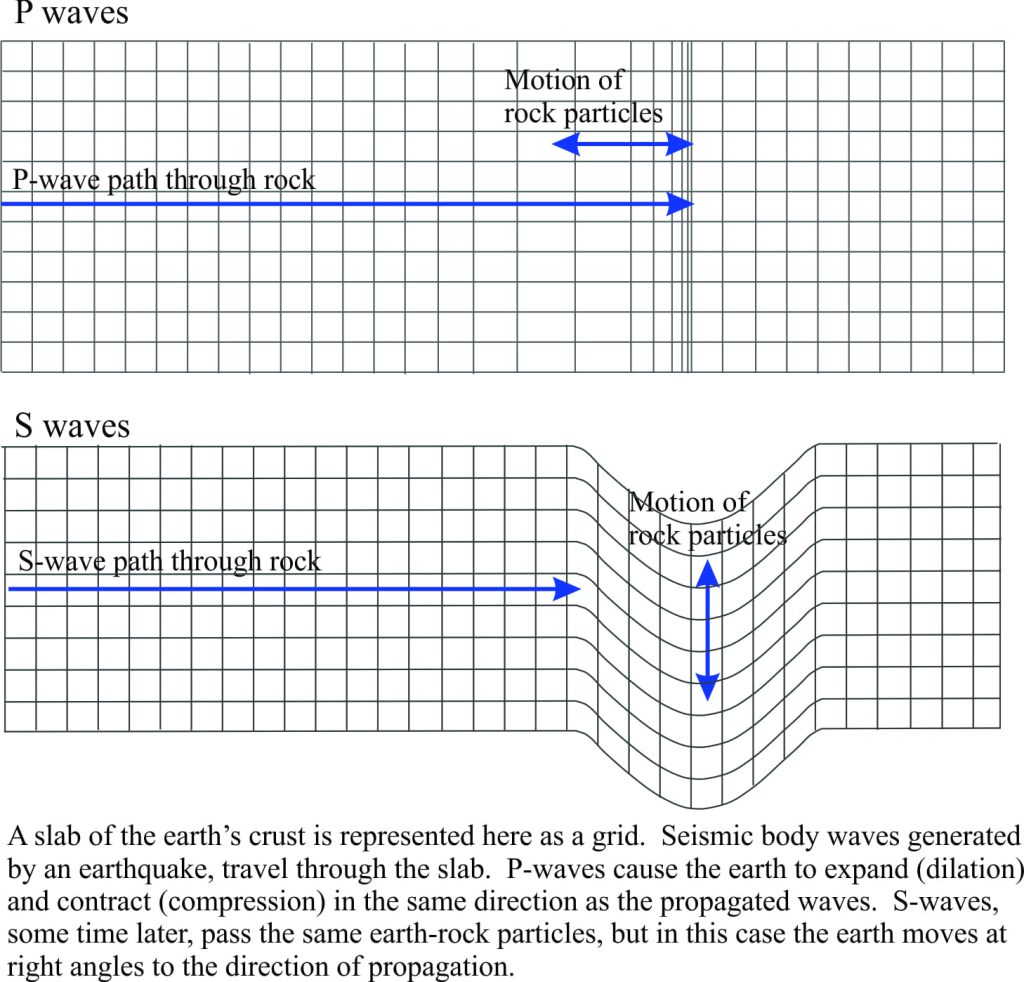 through fluids such as sea water, or the molten interior of the earth. The cartoon below illustrates how the earth reacts to these two wave types. Surface waves are the slowest to propagate but they are also the seismic pulses that do most of the damage during an earthquake. The animation shows the earth motion for one kind of surface wave;
Rayleigh Waves. Rayleigh Waves produce a circular, or orbital motion of earth materials at the surface, a bit like particle motion beneath sea waves.
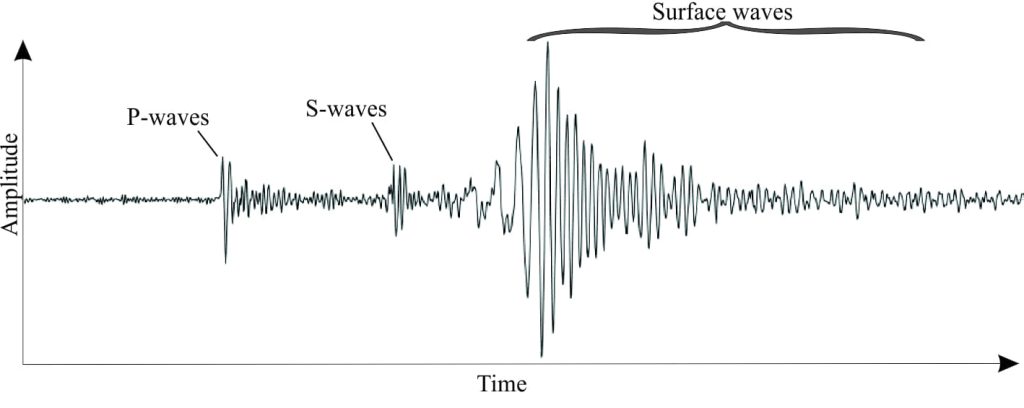
Each type of seismic wave is identified by the speed at which it moves, and the kind of movement that sediment and rock are subjected to. These differences are expressed on seismograph recorders. On a typical seismogram (below), P-waves arrive first, followed by S-waves. S-waves tend to have lower frequencies than P-waves (more spread out on the graph), but higher amplitude. Surface waves usually have the highest amplitude.
Earthquake magnitude (M) reflects the severity of ground roll and shaking, and on seismograms corresponds to the amplitude of the signal (usually of surface waves). M is expressed as a number (M1.8, M4.6, M7.8) up to a maximum of 10 (10 might be caused by a large meteorite impact – when there isn’t much left). The numbers, and therefore the magnitude scale, are logarithmic, such that a magnitude of 4 (104) is 10 times smaller than M5 (105), and 100 times smaller than M6 (106). We can also think of the changes in magnitude in terms of the energy released during a quake. It has been determined, (as an approximate empirical relationship) that for every unit increase in magnitude, there is a 27.5-fold increase in energy. The difference in energy is also logarithmic, such that an M8 event releases 571,914 times more energy than an M4 event (the magnitude is 10,000 times greater). These kinds of numbers demand a degree of respect for the twists and turns our earth can throw at us.
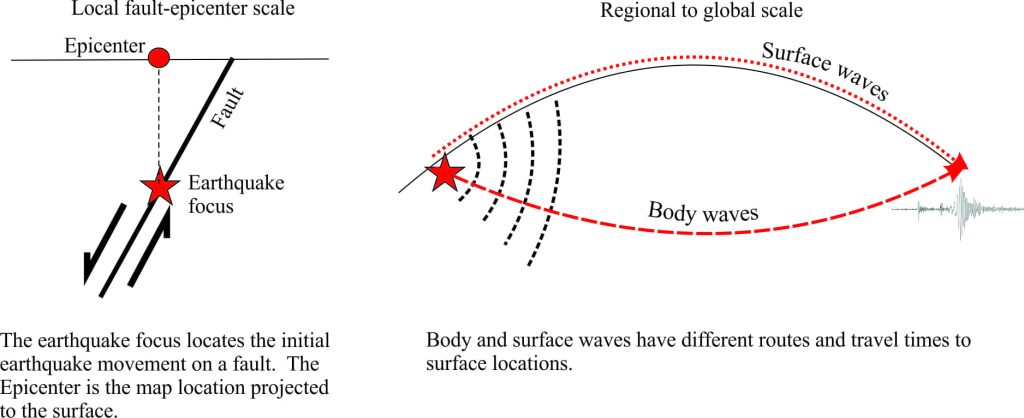
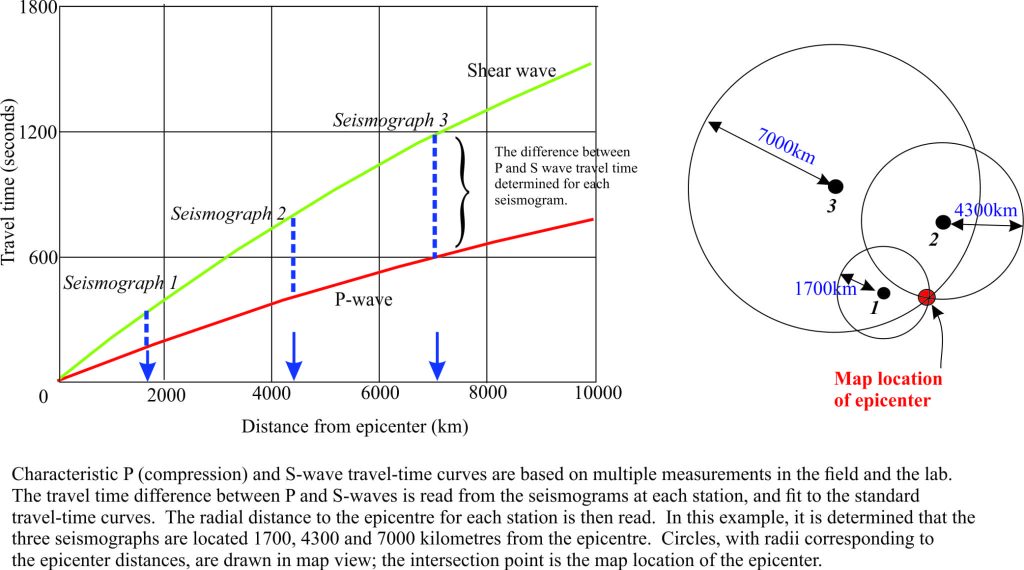
Seismograms also help seismologists determine the Epicenter of an earthquake; the epicenter is the map location rather than the actual location, or focus, at depth. The calculation makes use of the fact that P-waves are faster than S-waves, so that the distance to an epicentre is based on the difference in arrival times for each type of wave. Distance in this case is the radius of a circle centered on the seismograph location. To triangulate the epicentre, at least two more seismographs in different locations are needed – in reality there can be hundreds of seismographs that allow the calculation. If circles are drawn about each seismograph, each with a different radius, they will intersect at the epicentre. Variations in the structure of the earth mean that seismic wave velocities can vary, so that the circles may not all intersect at a single point. However, the large number of seismographs around the world means that location of the epicentre is usually accurate.
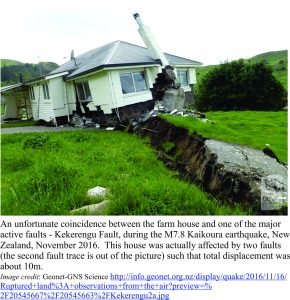
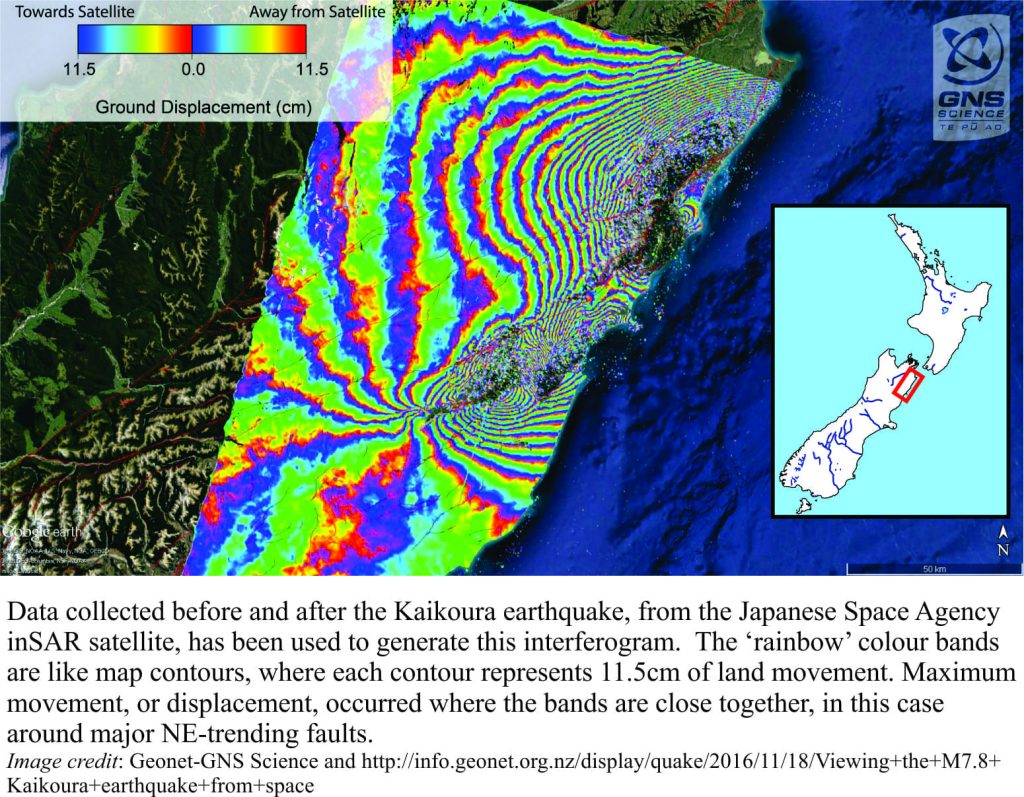
The November 14, 2016 earthquake in Kaikoura, New Zealand was a M7.8 event. We live about 500km north of the epicentre. Almost on the stroke of midnight we felt definite shaking (P-waves). A few seconds later the shaking increased significantly. At this point trees were swaying and water was slopping over the edge of the pool; this was due to ground roll from the slower surface waves. Other than an adrenaline rush, there was no damage for us; farther south it was a very different story. One spectacular outcome was the abrupt, lateral 6m shift along part of the New Zealand coastline; the same coast was also uplifted 1-2m.
I’ve always thought that New Zealand is a great place to witness geology in action. But sometimes it can go a bit too far.
An excellent technical paper on the Kaikoura event by Ian Hamling (GNS Science) and a host of co-authors, has been published in Science, March 26, 2017.


2 thoughts on “It only takes a moment; the ups and downs of earthquakes”
Un excelente articulo. Tengo una pequeña inquietud. Los trazos de las fallas en los dibujos por lo general llegan a la superficie. He escuchado decir en las noticias que la profundidad del epicentro es de p.ej. 150 Km. esto me parece un poco inverosímil, debido a que si un sismo se origina por algún desplazamiento a lo largo de alguna falla el desplazamiento de la corteza a lo largo de ambos lados de la falla debería llegar a la superficie. Creo más bien que si este fuera el origen, desplazamiento a lo largo de alguna falla, esta energía se disiparía en un diseño compuesto por fallas que se superponen y entrecruzan en un sistema como de bloques. Entiendo que por razones de pedagogía se resuma de esa manera, pero me parece poco creíble que el origen de un sismo se de a cientos de Kms. de profundidad (por debajo de la discontinuidad de Mohorovich). Cual es la profundidad máxima de una falla, logran atravesar la corteza terrestre y llegan al manto? Que otro evento (Comprobado) crea un sismo?
Traduccion Google.
An excellent article. I have a little restlessness. The traces of the faults in the drawings usually reach the surface. I have heard in the news that the depth of the epicenter is 150 km. This seems to me a little implausible, because if an earthquake is caused by some displacement along some fault the displacement of the crust to Along both sides of the fault should reach the surface. I think rather that if this were the origin, displacement along some fault, this energy would dissipate in a design composed of faults that overlap and intersect in a system as blocks. I understand that for pedagogical reasons it is summarized in that way, but it seems to me to be unbelievable that the origin of an earthquake is hundreds of kilometers deep (below the Mohorovich discontinuity). What is the maximum depth of a fault, are they able to cross the earth’s crust and reach the mantle? What other event (Verified) creates an earthquake?
Some faults do extend to the base of the crust and beyond – these are plate boundary faults like San Andreas, California, and Alpine Fault NZ. However, not all Faults reach the surface. For example, deep epicenters in the deeper parts of subduction zones can be associated with very high magnitude quakes, but the faults do not extend to the surface, and the damage done is usually much less than quakes and faults that are much shallower. Shallower faults that extend to the surface are the ones that tend to do the most damage.